Today’s outline
- Terrible Earnings Season
- Historical Precedent
- Evidence Suggests Downside Risk
- Historical Precedent…
- …Suggests Downside Risk
- Follow the Trend
- Interesting Bet
This Week Posts
- eCommerce Outlook 1Q22, May 21st, 10 pages 🌟
- Expert Interview - Sinqia, May 19th, 8 pages
- $SE 1Q22: Upside Risk on Monetization, May 18th, 10 pages
- $NU 1Q22: The Purple Wave, May 17th, 8 pages
- Keep it Simple, May 16th, 5 pages 🌟
- Food for Thought #17, May 15th, 9 pages
Premium Posts in May 🌟
(Long-form only)
- MercadoLibre ($MELI) (Pinned), 29 pages
- Stone's Biggest Moat (Pinned), 14 pages
Milestone Watcher
→ 210 Pages, 85% Without a Paywall, 10h Expert Channel-Check Calls in May.
→ 1058 Pages In 2022, 1,600+ Hours Researching, 92 Issues Published.
Premium Post Pipeline
→ 05/28/2022: Stone Model Explained + Cheatsheet
→ 05/23/2022: Portfolio Update
Terrible Earnings Season
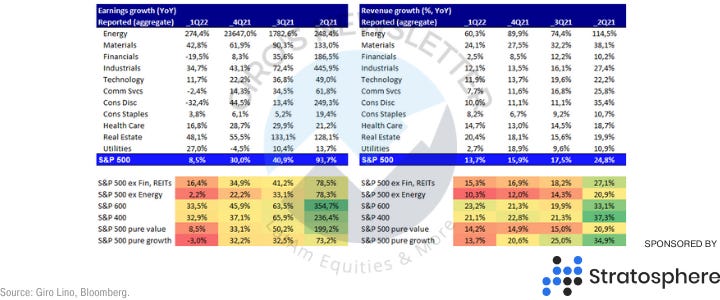
Considering that 95% of the S&P 500 reported in the quarter, it sounds fair to go over the big numbers and to think about it.
Results consistently exceed the sell-side expectations leading to the so-called “upward revision” for the remainder of the year and possibly for the following.
Why “as always”? It’s in the best of any bank's interest to be seen positively by its clients, meaning that:
- Most analysts carry a “buy” or “neutral” rating on the stock;
- they always try to underestimate earnings to write positively about the company.
So, curiously, again, the pure growth companies led the favorable surprise ranking. After all, the sector paying Investment Bankers’ bills is tech. Except if you want to lose your job as an analyst, better be bull on them.

However, the media is not telling you that analysts were estimating a mild 3.4% earnings growth (YoY), and the aggregate reported growth was 8.5%.
Considering an 8% inflation (YoY), analysts expected a retraction, and the actual real earnings growth (YoY) was null. Meanwhile, for the growth stocks, Nominal earnings contracted 3% YoY, for growth companies, while revenue growth decelerated to 13.7%.

Also, considering both earnings and revenue growth, net margins are contracting for most industries, possibly due to higher inflation.
Finally, we believe the industries that presented the weaker earnings were financials and consumer discretionary.
Banks provided guidance about how their NII was improved by higher rates in the past. However, inflation was controlled in those circumstances, and the economy was actually doing well.
We wrote why we dislike banks in a different post.
For consumer discretionary, the industry has a lot of operational and financial leverage, so the current environment is extraordinarily challenging.
Historical Precedent…
In March, we wrote about the economic consequences of wars. First, war is Inflationary. We’re living the strongest start to any year since 1915 for commodity prices; all-time high in the price of coal/aluminum, oil/wheat highest since ’08.
Second, war is Stagflationary. For example, the Yom Kippur War (Fourth Arab-Israeli War) began in October 1973 and ended in April 1974. Though the war itself lasted for six months, its consequences prevailed longer.
In the past couple of weeks, the number of research mentions stagflation is incredible as it was something extraordinarily unexpected.
The S&P 500 fell 40% from the previous high during the period, and the only two sectors to outperform inflation were Oil&Gas, and Copper.
Also, the Fed tightened the market to control inflation, but oil prices didn’t reverse until 1975. So the crisis only ended when the Fed changed its course, slashing Fund Rates from 14% to 3%.
We believe that UBS did well creating a stagflation index for the economy. At 3.3 standard deviations relative to its history, today's US Stagflation Pressure Index’s reading is not far from a 1970s peak reading of 5.

The problem is the only sample that fits a comparison is with the 1970s so far. However, we recognize that after 50 years, the pressure should be much less persistent.
During the 1970s, the stagflation lasted for +10 years(!), which is not our base case. Not even close to it, sincerely.
…Suggests Downside Risk
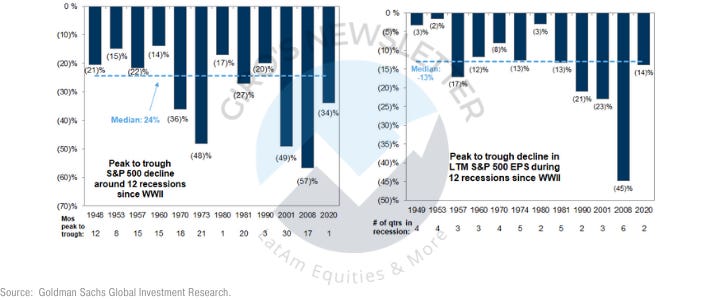
Probably not. Goldman conducted research gathering evidence from the previous 12 recessions since WWII, showing the S&P 500 index has contracted from its peak to bottom at a median of 24%.
A decline from the S&P 500 peak of approximately 4800 in January 2022 would bring the S&P 500 to 3650. The average decline of 30% would reduce the S&P 500 to 3360.
Curiously, this range would match with our bear case, which was introduced a few weeks ago when we wrote:
We maintain our base case 4,200 target for the S&P 500, introducing a new bear scenario, where Powell’s bet fails, and Financial Condition Index (keep reading) overshoots in 100bps, with a 3,300/3,600 target.
Unlike Goldman, though, we used real rates as input, compiling the historical data and estimating what an overshooting would cause on asset prices.
However, this crisis has been showing something different from the previous. For instance, in the earlier recessions, the S&P 500 earnings have dropped by 13% from peak to trough recessions.

Except for pure growth stocks, all industries present positive earnings growth YoY. That may suggest that the crisis hasn’t started or that we’ll see a few industries bleeding.
Follow the Trend
Assuming that we have to wait until earnings growth inflection to start considering it a crisis, probably 12-24 months. In that case, recessions since 1990 provide a guide for the path of EPS revisions around a recession.
During the last four recessions, the typical revision to consensus EPS estimates during the 6 months before the start of a recession has ranged from -6% to -18%, with a median of -10%.
During the 6 months following the recession, analysts reduced EPS estimates by an additional 13%. During the 12 months surrounding the start of a recession, analysts reduced forecasts by 22%.
However, our base case considers stock prices. As mentioned, it’s barely impossible to guess for specific nuances of each crisis. Instead, stock prices can be tracked for longer, giving us more evidence.
Also, liquidity is very low. The positioning at -2 st. dev indicated a high degree of uncertainty, increasing the odds of an overshooting in prices.

Interesting Bet
We’ve said that hundreds of times, but we like to place small bets on contrarian trades, and a huge risk when the downside is inexistent is tiny.
Premium Subscribers know that, but we hardly place a bet over 2% of the portfolio. Currently, we only hold one big boy in the portfolio, which is our long XOP, and short XLF.
We wrote about it in February, right before jumping in. Even though the trade is up 50%, we believe a pleasing asymmetry is in its favor.

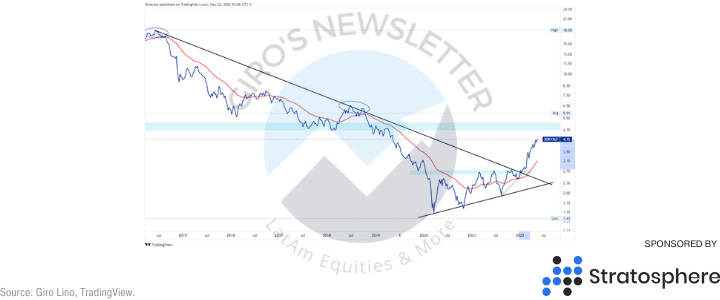
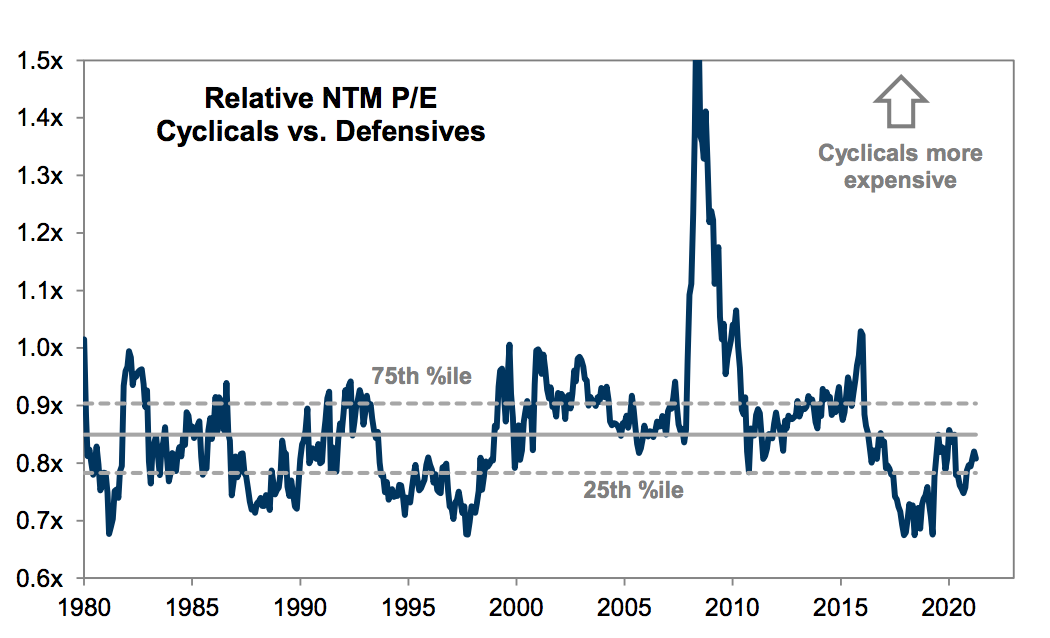
Also, there is new trade we’ve been studying for a while. According to our estimates, the relative performance between cyclical and defensive stocks indicates a depression much worse than the actual.
The ISM currently stands at 55, but the relative performance of cyclical vs. defensives would imply a level around ~45, which is a damn difference.
The trade could be affected by lower liquidity, or simply because investors are too afraid to jump in it. Whatever the reason is, it looks asymmetric. Remember: there is no such thing as perfect timing, just good and bad asymmetries.


