Today’s outline
- The best least
- Handle the chips
- The next FED put
- Value in Relative Value
- Rotate to lending in China
- What am I doing with my $FB position? (PRO Content)
- Betting in a turning point for economic growth (PRO Content)
- Clash of titans: $VALE vs. $PBR (PRO Content)
- A bear scenario for oil has emerged (PRO Content)
The best least
In January, I wrote on Twitter that investors should favor $PBR over Russian and Chinese oil companies because of events these countries have been through.
Foreign investors have bought almost $6bn in Brazilian equities, which is a considerable value given the market liquidity.
Indeed, there is a bull scenario for Brazilian equities, but that doesn’t come without volatility, specifically considering that the country is going through an election year.
Last month, I took the opportunity to realize a gain in many Brazilian equities and load up more US equities.

Handle the chips
Oil has just posted a two-month rally that ranks in the top 99.7% of Sharpe ratio in the last twenty years. But, importantly, time spreads still look relatively undervalued vs. our expectations of OECD inventories even after the rally.
I wouldn’t discard that even with Brent prices above $100/bbl in 2023, the risk would still be asymmetrically higher.
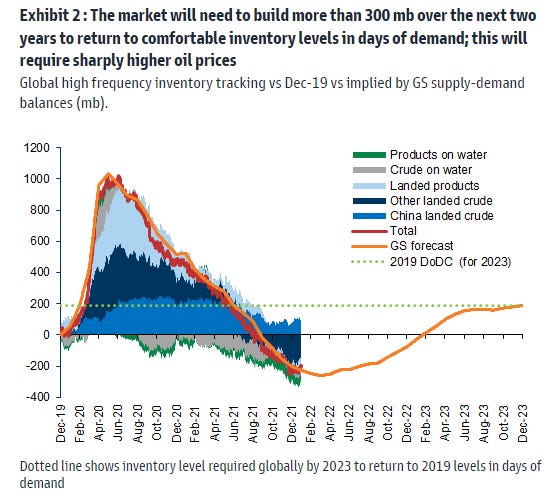
For almost a decade, selling option tails was a very profitable trade. Perhaps, we might be entering a new decade where buying the right tails will prove to be cheap.
However, it’s important to highlight that a new risk has emerged to Oil prices. I’ll be exploring this topic again in the PRO section.
I recently changed my preference over $PBR to 3R Petroleum, a Brazilian Small Company showing strong execution amid favorable conditions.
The next FED put
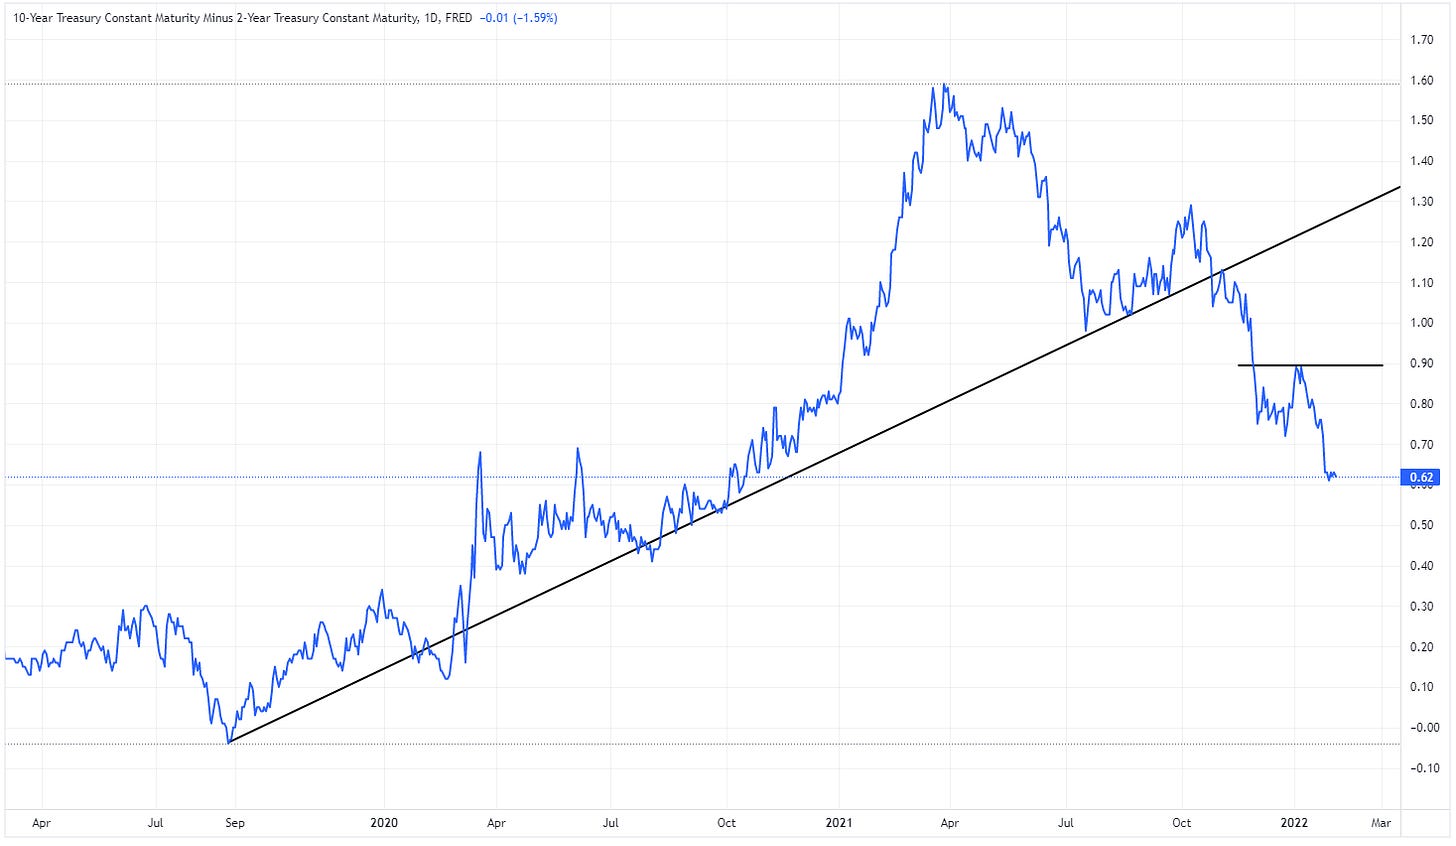
Since January, the spread between 10yr and 2yrs maturity USTs have been pricing lower growth ahead. If the curve stays under pressure, perhaps the FED creates the narrative that lower growth will help with inflationary pressure and, therefore, there is no need for many hikes.
Also, from a fundamental perspective, the Russel 2000 small-cap index, composed essentially of cyclical small-cap companies, has been showing signs of growing weakness.
Since November, the bottom-up consensus forecast for Russell 2k profit margins dropped 4p.p. in 2022. Also, roughly a third of Russell 2000 stocks are expected to have negative net income over the next twelve months.
The Russell 2000 outperformed dramatically in 2H 2020 and 1Q 2021 as the economy rebounded from the COVID downturn, but the trade peaked at roughly the same time as the ISM Manufacturing, in March 2021.
Looking forward, consensus expects a tactical rebound in the 2Q 2022, though they expect an annualized rate of just 2% for GDP growth.
Hey, since you have received my stuff for more than a month now, why don’t you redeem a free trial coupon?
Value in Relative Value
Considering both scenarios, where the UST10y2y keeps flattening, and market conditions tighten, trading relative value for “Value Factor” companies could be fantastic.
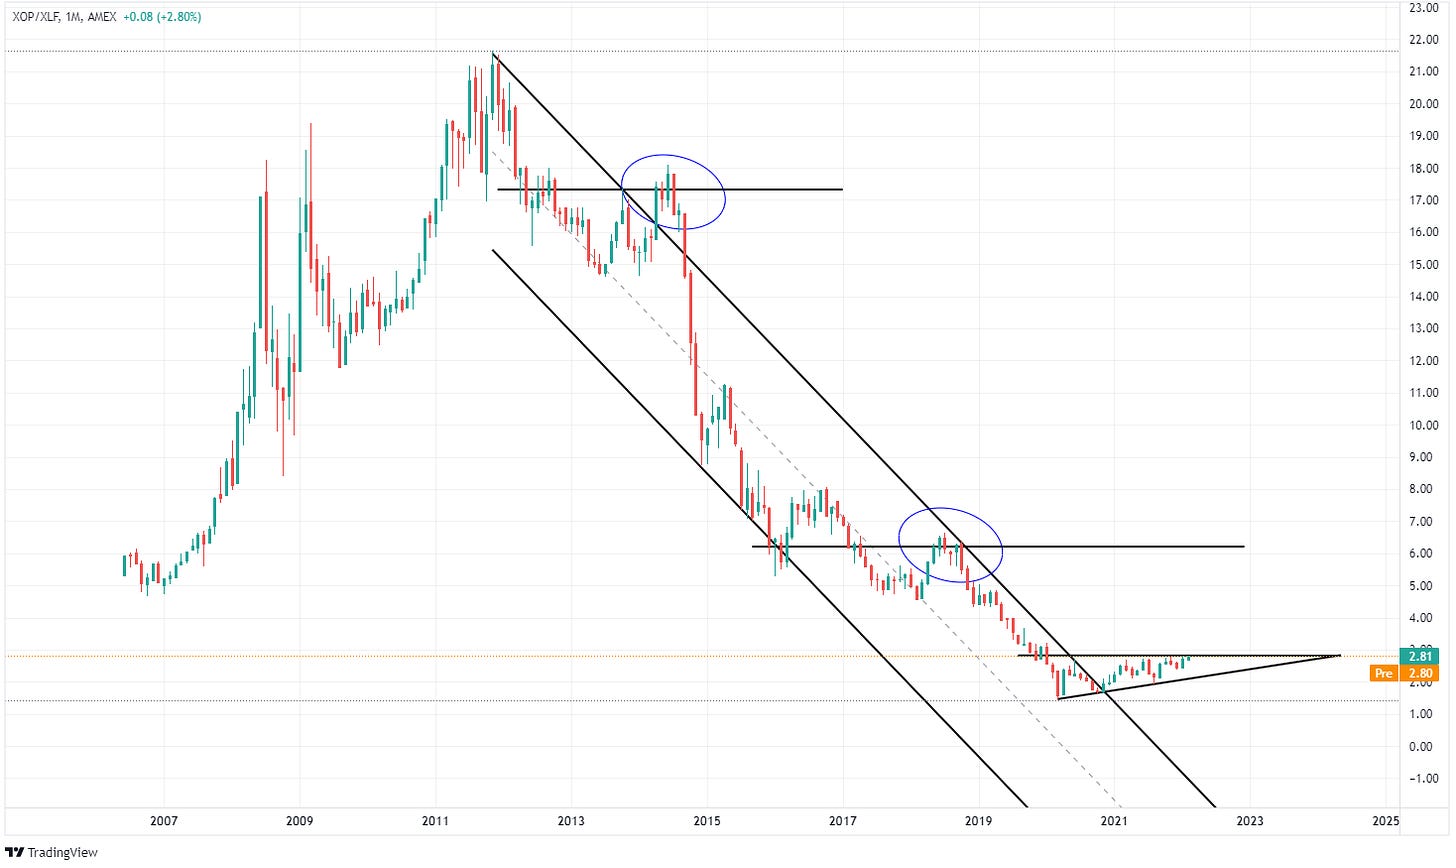
The chart above illustrates the ratio between $XOP (S&P E&P ETF) and $XLF (S&P Financial Sector ETF), breaking a ten-year pattern.
During this period, Oil companies have been losing value given lower Capex levels and Oil prices, while financial institutions were making less money — indeed —but in a less non-inflationary period.
If the supply side for oil keeps pressured for a more extended period, we might see a surrounding outperformance in E&P companies against Financials.
Rotate to lending in China
The market is upgrading forecasts for iron ore given supported by restocking ahead of the Chinese New Year, weather supply concerns in Brazil and Australia, and a new stimulus round announced in China.
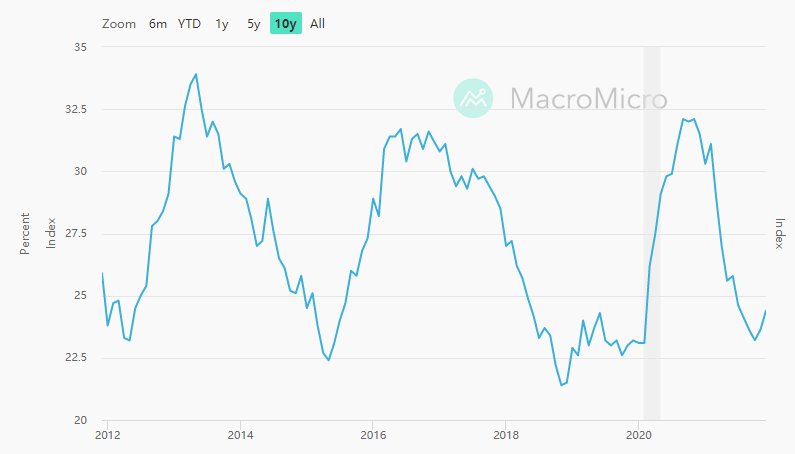
The image above short that the BBG China Credit Impulse Index (new loans / GDP
Credit) turned positive. Historically, the index has been a lead indication for iron ore prices, meaning that the commodity should build up momentum.
However, I think the supply side should normalize along de 2Q22, meaning that the movement could be tactical.
PRO Content
What am I doing with my $FB position?
It was quite a busy week, especially with $FB earnings. I joined a few calls to hear the bear case and stressed my estimates.
When a stock plunge as $FB did, that doesn’t mean you’re wrong, but you definitely should revisit your estimates, and so did I.
The decreasing DAU/MAU story doesn’t scare me. $FB’s DAU is 1/3 of the world’s population. So it’s impossible to assume the ratio would grow forever.
The second bear argument is that $FB is trading in a “bubble zone.” I heard that a few times. But unfortunately, nobody was able to give me an actual argument about the definition of “bubble zone” and how $FB fits in it.
In my estimates, $FB is trading ~12x cash earnings and the EPS CAGR for the next five years of 15%, considering contraction in its core biz’s margins.
I added $AMZN, $FB, $MELI, and a few other L/S trades along the week. Also, I closed a few ideas to fund these ideas.
Betting in a turning point for economic growth
As I wrote before, UST10y2y flattening is particularly discomforting for cyclical small-caps, translating into a significant underperformance against $SPY.
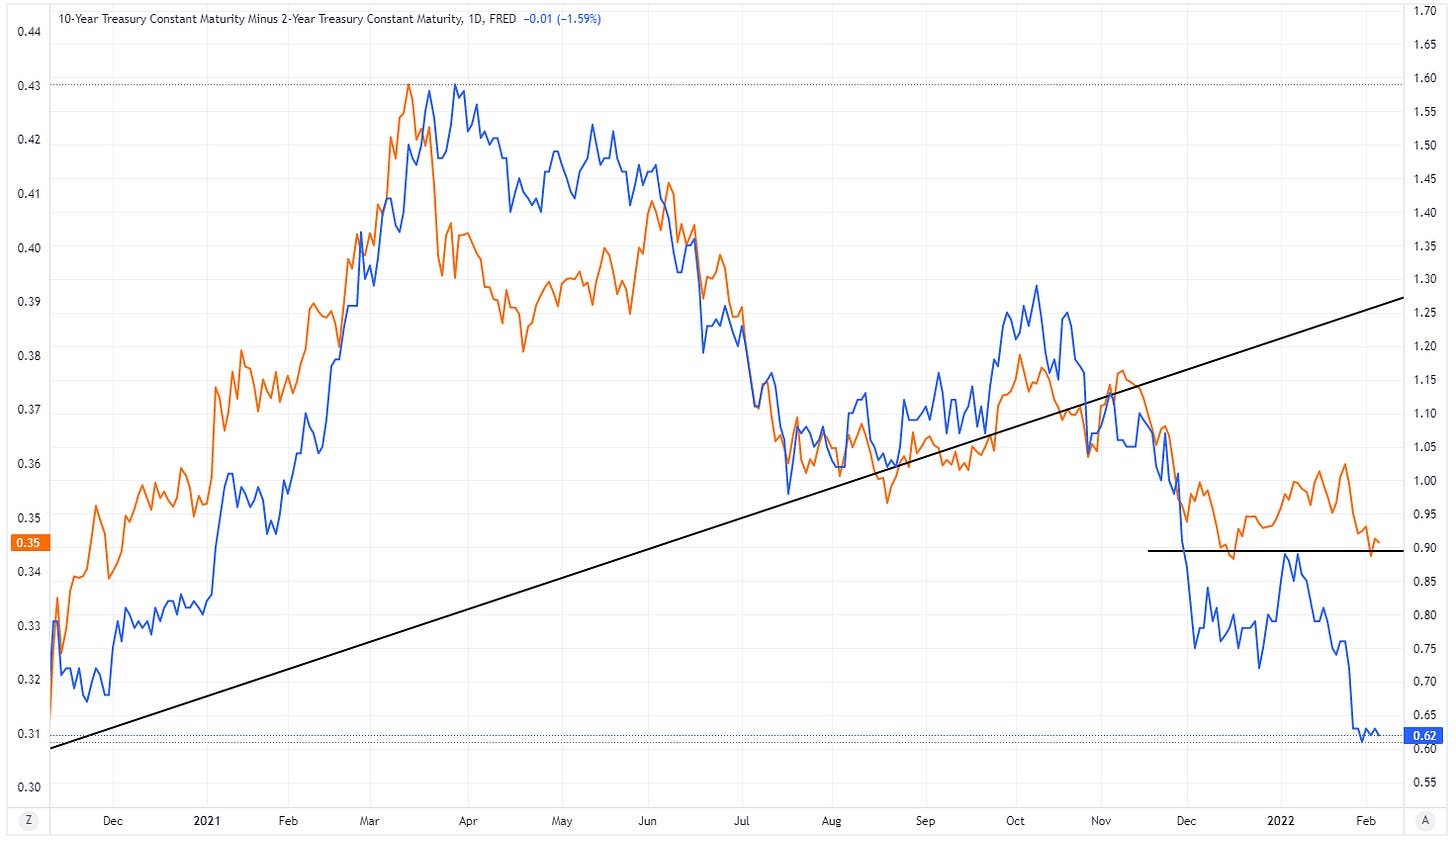
Market consensus has put $IWM under a terrible technical condition, as the curve keeps flattening. If, somehow, a steepening in the curve could change in conditions could lead to an aggressive position covering in $IWM.
Clash of titans: $VALE vs. $PBR
An old debate in Brazilian markets is whether you should own $VALE or $PBR. I’d been favoring $PBR for quite a while since Credit Impulse turned negative last year.
However, as the Chinese government opened the tap for credit lenders again, I must say that I’m inclined to favor $VALE again.
This year we have elections in Brazil. Usually, price action becomes uncorrelated with Oil prices when campaign rallies start since $PBR is a state-owned company (SOE).
As I mentioned before, I bought 3R Petroleum (BVMF: RRRP3), but you should do fine with $XLE or $XOP if you don’t want to diversify your commodity thesis.
A bear scenario for Oil has emerged
Yesterday, the US waived new sanctions on Iran’s "civil nuclear program." No political bias, folks.
The sanctions increase the risk of Iran coming onto the market, selling its inventory, and producing more oil.
Iran would have almost 1,3mbd spare capacity to ramp up the next 12-18 months. Also, Iran exports nearly half of its volume in the past, so this number doesn’t look absurd.
I’ll be looking carefully at the week's price action and changing positions as price actions demand.
Disclosure: All posts on Giro’s Newsletter are for informational purposes only. This post is NOT a recommendation to buy or sell securities discussed. So please, do your work before investing/gambling your money.


