
In the realm of statistics, the median stands as a crucial measure of central tendency, offering invaluable insights into data distribution. The median is particularly useful when analyzing quantitative data, which involves numerical information that can be measured and compared. This comprehensive guide delves into the intricacies of the median, exploring its definition, calculation methods, and practical applications in diverse real-world scenarios.
What is the Median in Mathematics?
The median is a statistical concept that represents the middle number in a sorted dataset, effectively dividing it into two equal halves. As one of the three most common measures of central tendency (alongside mean and mode), the median provides a robust representation of typical values in a data set.
Key Characteristics of the Median
- Central position: 50% of the values in a dataset fall below the median, while the other 50% lie above.
- Ordinal nature: The median can be determined for both numerical and ordinal data.
- Robustness: The median remains unaffected by extreme values or outliers.
How to Calculate the Median
To calculate median, you need to follow a straightforward process that varies slightly depending on whether the dataset contains an odd or even number of data points. Let’s explore the median formula and step-by-step approach for finding the median.
Steps to Find the Median
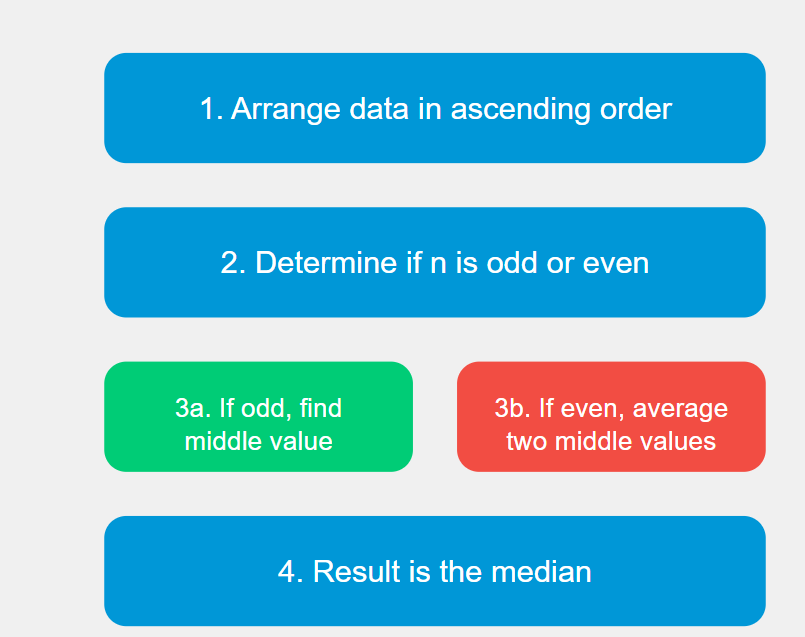
Here are the steps on how to find median in a dataset:
- Arrange the data values in ascending order or descending order.
- Determine if the total number of data points is odd or even.
- For an odd number of values, find the middle data point.
- For an even number of values, calculate the average of the two middle values.
Median Formula
For a dataset with n values:
- If n is odd: Median = value at position (n + 1) / 2
- If n is even: Median = average of values at positions n / 2 and (n / 2) + 1
Median Examples
Let’s look at some median example to illustrate the calculation process:
Example 1: Odd number of data points
Given data: 2, 5, 8, 4, 9, 6, 7
- Arrange in ascending order: 2, 4, 5, 6, 7, 8, 9
- Find the middle value: 6 (4th position in a list of 7 numbers)
Therefore, the median is 6.
Example 2: Even number of data points
Given data: 3, 11, 7, 2, 5, 9, 2, 10
- Arrange in ascending order: 2, 2, 3, 5, 7, 9, 10, 11
- Find the two middle values: 5 and 7
- Calculate the average: (5 + 7) / 2 = 6
Therefore, the median is 6.
Comparing the Median to Other Measures of Central Tendency
Understanding how the median relates to other statistical measures helps in choosing the most appropriate metric for specific analysis needs.
Median vs. Mean
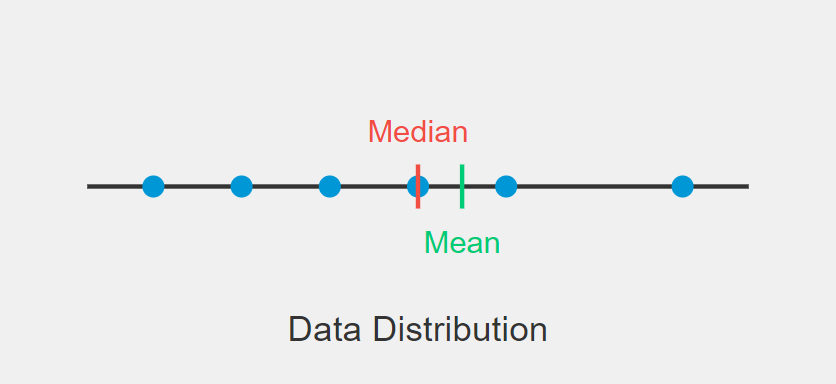
The median often provides a more representative measure of central tendency than the arithmetic mean, especially in datasets with extreme values or skewed distributions.
Example: Consider the following data set of home prices: $200,000, $220,000, $240,000, $260,000, $1,000,000
- Median: $240,000
- Mean: $384,000
In this case, the median better represents the typical home price, as it's not influenced by the outlier value of $1,000,000.
Median vs. Mode
While the mode represents the most frequently occurring number in a dataset, the median provides the central value. In some cases, these measures may coincide, especially in symmetrical distributions like the normal distribution.
Real-World Applications of the Median
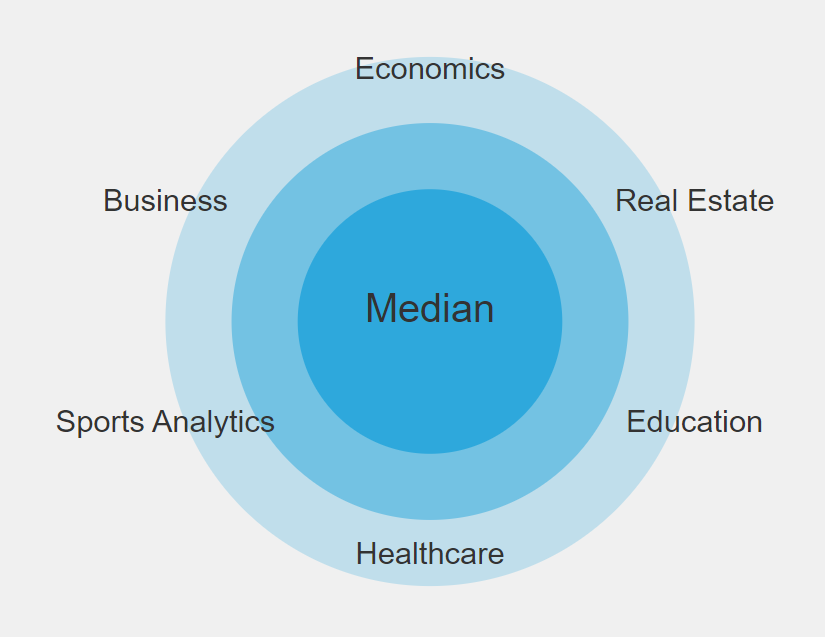
The median's versatility and robustness make it an invaluable tool across numerous domains:
- Economics: Median income provides a clearer picture of typical earnings than average income.
- Real Estate: Median home prices offer a stable indicator of housing market conditions.
- Education: Standardized test scores often use median values to benchmark performance.
- Healthcare: Clinical trials report median survival times to indicate treatment efficacy.
- Sports Analytics: Median performance metrics help set realistic goals for athletes.
Business: Customer analytics benefit from median values to understand typical behavior patterns.
Advanced Median Concepts
For those delving deeper into statistics, it's important to understand how the median relates to more complex concepts:
Probability Distribution
In continuous probability distributions, the median represents the value that divides the distribution into two equal areas.
Sampling Distribution
When working with multiple samples, the sampling distribution of the median can provide insights into the reliability of the median as an estimator.
Cumulative Frequency
In large datasets, cumulative frequency methods can be used to estimate the median, especially when dealing with grouped data.
Calculating the Median in Excel
For those working with large datasets, Excel provides a convenient way to calculate the median:
- Enter your data into a column.
- In an empty cell, type =MEDIAN(
- Select the range of cells containing your data.
- Close the parenthesis and press Enter.
Excel will automatically calculate the median of the selected data points.
Conclusion: The Power of the Median in Data Analysis
The median's robustness, versatility, and interpretability make it an essential tool in statistics. From providing insights into income distribution to evaluating medical treatment efficacy, the median offers a reliable measure of central tendency across diverse fields.
As you work with datasets, remember that the choice between the median and other measures depends on factors such as data distribution, the presence of outliers, and your specific analysis goals. By thoughtfully selecting and interpreting statistical measures, including the median, you can unlock valuable insights that drive informed decision-making across various domains.
FAQ: Common Questions About the Median
Is the median the same as the average?
A: No, the median and average (mean) are different measures of central tendency. The median is the middle value in a sorted dataset, while the average is calculated by summing all values and dividing by the count of values.
How do you find the median quickly?
A: For small datasets, arrange the numbers in order and find the middle value(s). For larger datasets, use statistical software or spreadsheet functions like Excel's MEDIAN().
What is the median of the numbers 1 to 10?
The median of 1, 2, 3, 4, 5, 6, 7, 8, 9, 10 is 5.5. Since there's an even number of values, we average the two middle numbers (5 and 6).
How do you find the mean, median, and mode?
A: Mean: Sum all values and divide by the count of values. Median: Arrange values in order and find the middle value(s). Mode: Identify the most frequently occurring value(s).
What does the median represent in statistics?
A: The median represents the central or middle value in a dataset, dividing it into two equal halves. It's a measure of central tendency that's resistant to outliers.
Remember, understanding these concepts and practicing with various datasets will help you become proficient in working with the median and other statistical measures.


