
Hi.
I really thought about what would be the best content design for Part II. In Part I, we spent a great deal of time writing about TAM, SAM, opportunities, tailwinds, headwinds, etc.
The idea is to present Nu’s valuation and strategic position in the competitive landscape. Also, to present a fair estimate for the company's fair value.
Both posts go beyond 50 pages (>30 pages in writing) and more than 80 hours of reading and writing about NU. So there is a lot of content put together.
I don’t expect that you agree with my writing, but consider it an honest opinion from someone who spent a lot of time thinking about it.
Also, I’m not done with Nubank. I still have many questions about the company that I don’t know how to answer. I know much less than what I expected before — this is great!
Research is the process of learning, especially about topics you didn’t know existed. So there is a bunch o stuff about Nubank I’ll have to keep studying and writing about.
Giro's Newsletter is a reader-supported publication. To receive new posts and support my work, consider becoming a free or paid subscriber.
Today’s Outline
- Pushbacks
- Will economic slowdown will impair top-line growth and client monetization?
- Will a higher interest rate hurt Nu’s cash flow?
- Asset quality is
the topconcern among most investors. Most used Stone as an example. Is this a real risk? - Nu’s multiple is expensive in any metric.
- Pivotal Questions
- Does Nu enjoy any competitive advantage?
- What is the most significant opportunity for Nu?
- ARPAC composition
- Cohort maturity
- LTV/CAC perspective
- Valuation
- Monte Carlo
Pushbacks
i) Economic slowdown will impair top-line growth and client monetization.
Even though Nubank has over 50 million clients, its product penetration is incipient except for credit cards. Over the years, Nubank has grown above its peers amidst a challenging macro environment.
Nubank is not a market share play but a product penetration one. Although Nubank issues a third (~33%) of all credit cards in Brazil, its current market share for interchange is barely at 7%.
Also, incumbents have a 30% penetration in the credit portfolio for retail, while Nubank has barely launched it. The consensus is considering 15%-30% penetration for Credit Card in 2026, which is okay, considering the capital cushion. Personally, I’m using 15%.
Giro's Newsletter is a reader-supported publication. To receive new posts and support my work, consider becoming a free or paid subscriber.
ii) Higher interest rate scenario will hurt Nu’s cash flow.
This is a fair question, considering that rates increased from 2% to 11,75% in a short period. This has prompted investor questions over whether rate rises will negatively impact Nu’s profitability, especially since higher funding costs have pressured Brazilian merchant acquirers.
I believe that this is unlikely to be a concern for Nubank. The F-1 indicates that Nubank is slightly asset sensitive (low mismatch between investment and deposits).
Also, Nu’s DV01, illustrated in the image below, shows little concern for raising rates. For instance, considering an average rate of 6,3% in the 3Q21, considering a 465bps shock on Nu’s balance sheet, the impact would be ~US$1,5mn. Again, minimal impact.
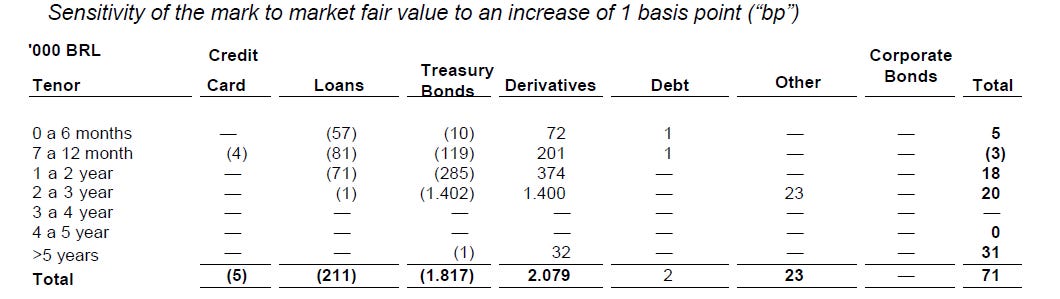
On funding, Nu has a considerable amount in excess capital, meaning that the requirement for funding is a limited risk. But, perhaps, in 2023/24, this would become a problem.
Finally, on payments, the delayed settlement period of credit cards in Brazil makes the card business neutral, as the bank does not require working capital to fund this operation.
Giro's Newsletter is a reader-supported publication. To receive new posts and support my work, consider becoming a free or paid subscriber.
iii) Asset quality is the top concern among most investors. Most used Stone as an example. I disagree with them.
First, on Stone, I wrote extensively about the company on this blog, so I’ll refer to the articles you should read to understand what happened. Even though Nubank has shown outstanding growth since 2018, evidence shows no disruption in its asset quality.
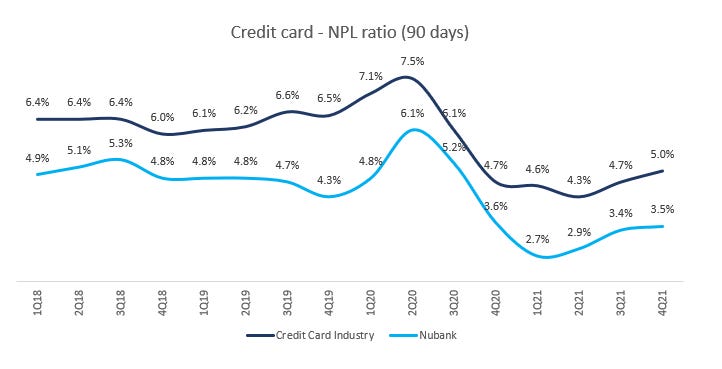
Nu has typically started customer relationships with the credit card or NuAccount (NuConta) products, then grown the relationships significantly over time.
As Nu learns more about its customers, it can responsibly raise credit limits and introduce new personal lending and insurance products.
So far, Nu has been showing superior proprietary underwriting capabilities versus peers. Also, the company ended 2021 with a ~320% coverage ratio (vs. Itaú’s 220% and SFN’s ~200%).
We’ll talk about it through the post, but Nu will consume its excess coverage ratio with its new products and client base growth.
This is an enormous cushion. In my estimates, Nu will finance its entire growth until 2025 using proceeds from the offer and holding a cushion above 200%, though I’m considering an NPL ratio of ~6% by them.
Therefore, as far as Nu can replicate its underwriting model to expand in different geographies, asset quality is not depriving me of sleep.
iv) Nu’s multiple is expensive in any metric (P/Sales, P/Client, P/B, Dividend,…)
For those reading my pieces for a while, you probably know the answer to this for one. The only metric I use to determine value is cash earnings. I do not know any other metric that is actually evidence-based, except for cash earnings.
Nevertheless, mail me if you possess any material proving scientifically that any of those metrics work in 30+ years. I’d be glad to change my mind over that.
Pivotal questions
Does Nu enjoy any competitive advantage?
Yes, but a few things first. Then, I’d like to take a few paragraphs to propose my definition of barriers to entry. I spent most of my time working solo in the past decade, so the different range of descriptions I’ve witnessed in the past few months on Twitter has been astonishing.
There are supply-based barriers to entry, demand-based barriers to entry, and arguments related to economies of scale and customer captivity.
Very importantly, what is not a barrier to entry, as we will see, first-mover advantages are not barriers to entry. Branding is important, yes; is it a barrier to entry? Not quite.
And then we’ll basically efficiently link this idea for valuation purposes; how do we actually perform a strategic analysis in the context of a valuation and analysis?

Personally, the value of a company is the sum of the sustainable earnings and the growth earnings.
So, the idea is straightforward; a company enjoys barriers to entry if it can invest and generate returns on that invested capital that is higher than the weighted average cost of capital, the cost at which the company can fund itself in capital markets.
If there are barriers to entry, the return on invested capital is higher than the cost of capital of that company.
If there are no barriers to entry, the return invested capital should be equal to the cost at which the company can fund itself in capital markets.
In the following image, I’m listing all segments Nu operates, its moat sources, and considerations regarding each of them.
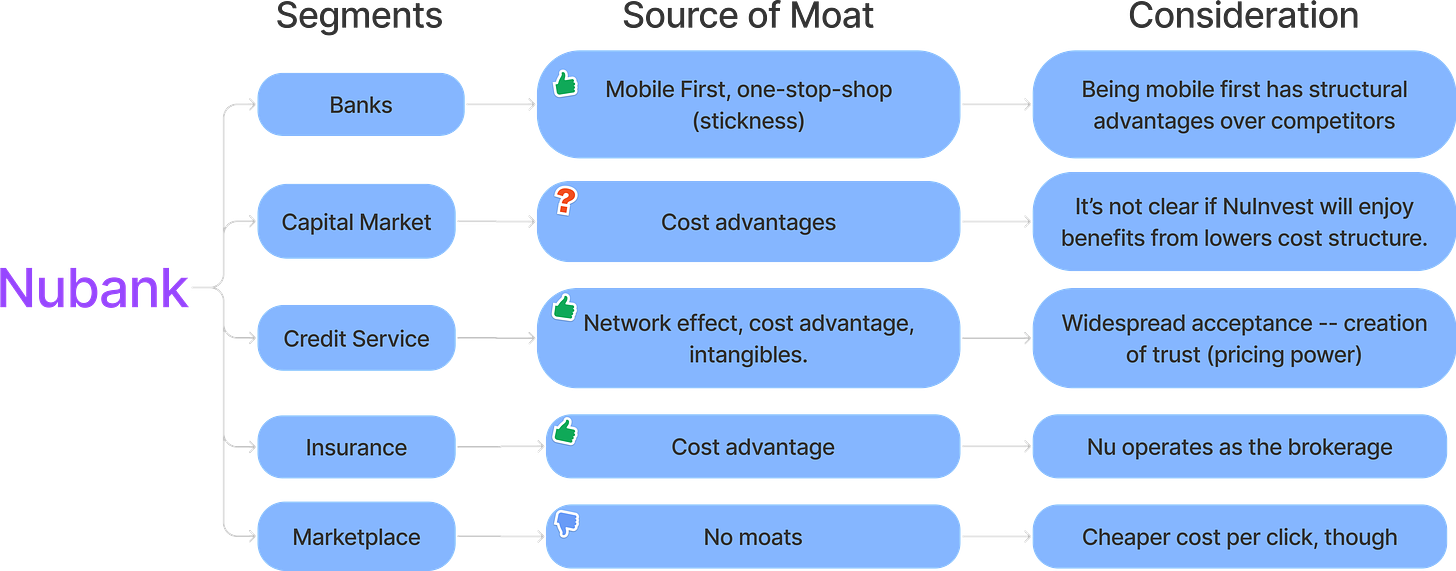
We went through 90% of these topics in Part I. I’d like to avoid being exhausting repeatedly, so if you have any questions regarding the considerations, address Part I again.
The most significant moats Nubank has are its stickiness in offering a top-notch experience to its clients and its lower cost structure that allows Nu to achieve superior profitability and the underwriting process.
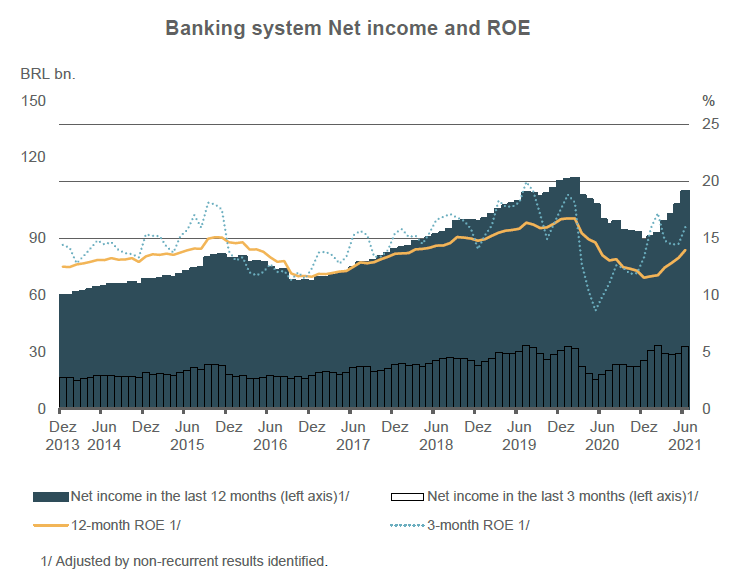
Looking at the financial system (companies reporting to Cosif), the profitability recovered from the pandemic shock and returned to pre-pandemic levels.
Although the outlook is more favorable, risks remain on the horizon. Credit margin may benefit from a more profitable mix ahead, but it should be under pressure by the Selic rate rise (currently at 11,75%).
The system recorded an aggregate net income of R$62 billion in the first half of 2021, 53% above that of the same period of the previous year and 3% above that observed in the first half of 2019.
In the first and second quarters of 2021, the system’s net income and return on equity levels were equivalent to those observed before the pandemic.
Among the main reasons for such low levels of financial inclusion in Latin America are the prohibitively high costs for financial services.
According to a study from the Inter-American Development Bank, or the “IDB,” one of the most cited reasons for not having a bank account is that opening and maintaining accounts is too expensive.
For instance, in Brazil, 30% of the 169 million people aged 15 and above did not have a bank account as of 2017, according to the World Bank.
As a result of this dynamic, Latin America is one of the most expensive banking regions globally, both in fees and NIMs, with Brazil and Mexico being one of the most expensive countries.
Furthermore, Latin America is one of the most profitable regions for the financial institution sector, and Brazil and Mexico are among the most promising countries for this sector globally.

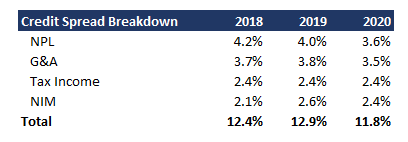
However, the origins of such inefficiency are not concentrated in the banking system — at least in Brazil. On average, breaking down the credit spread, the NIM for Brazilian banks was 2,4%.
Moreover, in an apples-to-apples benchmarking, according to my estimates, JP Morgan and Citigroup had a 3% NIM in 2021, precisely the same as Itaú’s.
The sources of inefficiencies that cause such higher spreads are:
- Judicialization of numerous loans, usually with higher values, driving exorbitant NPLs;
- Legacy costs related to branches. According to my estimates, the legacy cost impact of the credit spread is 120bps, impacting the Brazilian economy by tens of billions of Reais.
This is where Nu shines. Though their yield is priced just a notch below the industry average, the company has a superior NIM over its competitors. The image below shows the credit spread breakdown for the industry and Nu.
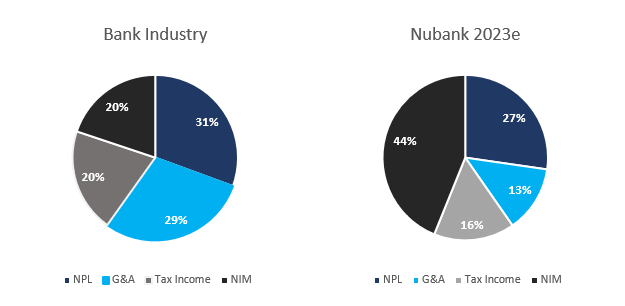
Nu presents higher profitability than its competitors, given its superior underwriting process (lower NPLs) and lower legacy costs, which drive higher spreads.
What investors should observe is the durability of those advantages. As highlighted in Part I, banks have been closing branches at a 2% CAGR pace over the past decade, so Nu could yield superior returns — at least — in the following decade until incumbents will have closed the G&A gap.
Furthermore, I researched Itaú’s ARPAC and compared it with Nubank. The conclusion is that the cost to serve clients in retail is MUCH more significant than the market assumes.
For instance, my estimates suggest that Itaú’s ARPAC will be more than twice Nu’s in the run rate, primarily because of corporate loans and payroll accounts.
Curiosity: Breaking down Itaú’s income statement for the apples-to-apples, I realized that cash earnings per active client for Nu and Itaú are very similar.
If I remove BNPL, marketplace, recharge service, and considerer only “classical” banking service ARPAC, the number is the same, meaning that Nu operates with twice Itaú’s margins.
The cost to serve these revenue lines is smaller than the retail, so in apples-to-apples, the impact branches and other legacy costs (data centers,…) are costing incumbents might perdure for longer than the market expects.
Finally, it’s worth mentioning that Itaú was the incumbent selected for my apples-to-apples benchmarking. The bank is the top performer among incumbents, so it’s reasonable to say the analysis isn’t overly optimistic.
What is the most significant opportunity for Nu?
As mentioned before, the segments in which Nu enjoys a relevant competitive advantage over peers are personal loans (underwriting and mobile-first) and credit cards (economies of scale).
About credit cards, as also mentioned, Nu is the big issuer of cards in Brazil (~33% market share), though its share in TPV is risorius.
So, I don’t believe Nu would have to employ much capital to gain a share, from its sub 5% market share in 2021 to >15% in the following years.
Therefore, lending is the most significant driver of revenue growth in expanding Nu’s credit business outside of credit cards.
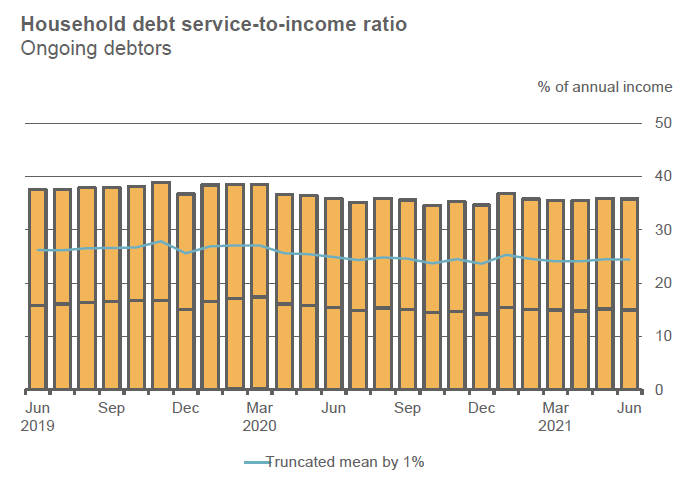
Within this, the largest source of growth is personal lending in Brazil. The level of the debt-to-income ratio increased in the last year. In the previous year, these values increased slightly. This growth is in line with the recent increase in the credit outstanding to households in SFN.

The debt service-to-income ratio levels of debtors show relative stability in the last year. It is noted that, despite the increase in the debt-to-income ratio for ongoing debtors, the debt service-to-income ratio has shown more resilience than the previous year.
Using the data from incumbents, ~40% of their interest income related to household comes from personal loans and payroll. Putting together with the data provided by the BCB, ~15% of household income goes to personal lending and payroll debt services.
The second consequence of its superior proprietary underwriting capabilities versus peers is that Nu offers very competitive personal lending rates among private sector incumbent banks, according to the data available on the BCB website.
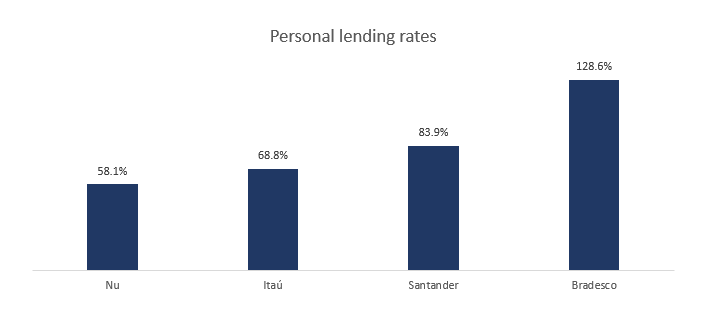
Presumably, Itaú’s lower rates are a consequence of its client base. However, Nu offers superior client experience (mobile-first) and competitive rates, which should boost its market share throughout the following years.
Wish to get more access to company information, such as financial impact from regulatory changes or exclusive content about meetings with industry participants? So, consider joining the Partnership.
ARPAC Composition
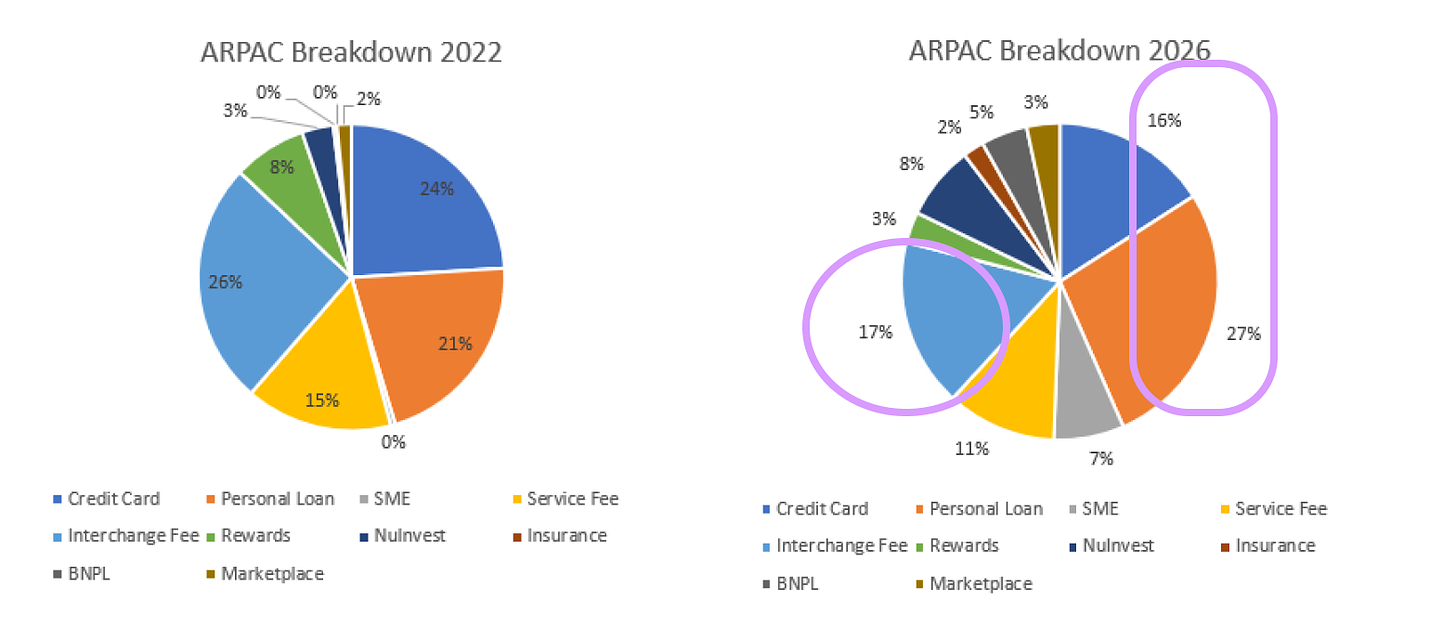
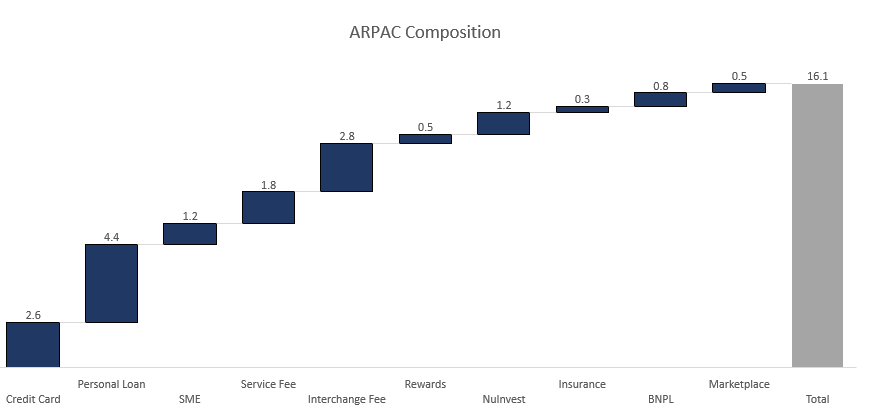
The picture of Nu’s ARPAC expected for 2022 presents the challenges Nu will have to go through to be the company I expect in 2026. Most businesses are incipient, with no revenue, or underpenetrated.
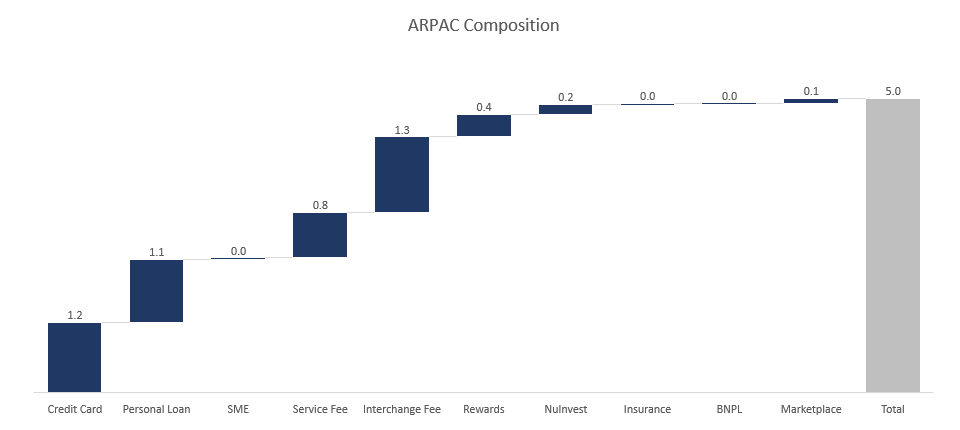
Nevertheless, my estimates consider that Nu will have marginal profitability in many businesses (marketplace, insurance, BNPL, and Reward).
Again, the value of Nu’s operation will come from Credit Card, Personal loans, Nu Invest (assuming a conservative take rate), and Interchange fees, as illustrated in the following image.
Cohort Maturity
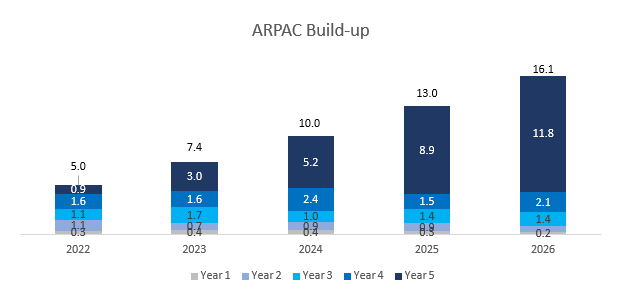
A different approach to estimating the ARPAC is considering the cohort’s maturity and contribution to the overall ARPAC.
First, considering the available data and that it takes, on average, five years to mature a cohort, in 2022, Nu would have only 6% of its clients in a mature stage, versus 53% in 2026, which largely explains the growth in ARPAC.

Second, assuming a maturity curve for the ARPAC, in 2022, the mature cohort would be responsible for 18% of the total ARPAC versus ~75% in 2026.
Finally, breaking down my expectations for revenue, the ARPAC growth would represent 38% of my revenue growth (22e-26e), while the growth of active customers is 62%.
Also, breaking down de ARPAC growth, almost 50% of its growth would come from new businesses and the remaining 50% from increased product penetration.
Though the growth in active customers is aggressive, my estimates for customer acquisition cost are conservative and, therefore, a less representative risk to the estimates.
However, the 20% CARG for the ARPAC growth sounds aggressive. Though the CAGR ex-inflation would be around 15%-17%, this is significant pricing power.
Therefore, my bear scenario for Nu would be a CAGR composed of 50% inflation and 50% penetration and product expansion, resulting in a bear $14 ARPAC for 2026.
LTV/CAC Perspective
I know most investors, especially those focused on tech companies, like to estimate the company’s LTV/CAC. According to management, Nu operates with an LTV/CAC around 30x.
It’s tough to replicate the number. Management probably referred to mature cohorts, so we don’t have access to gross margin assumption or the cohort’s churn.
Nevertheless, it was possible to estimate the consolidated LTV/CAC based on the previous maturity curve presented for the consolidated business.
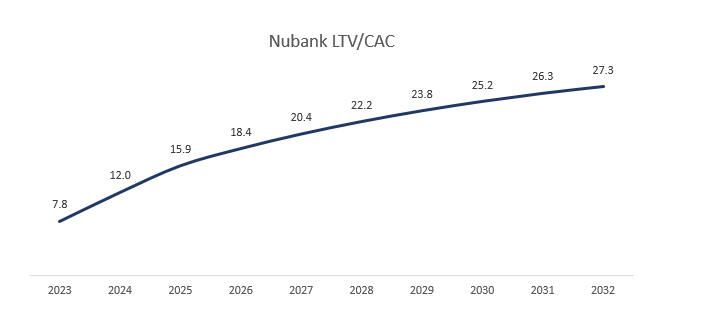
I did estimate the mature cohort LTV/CAC for 2023, adding back the cash burn per incremental active user, and reached a ~34 LTV/CAC, close enough to management’s comment.
Valuation
- The valuation is based on i) the steady return for the assets Nu already owns, without considering any growth, and ii) the return on incremental invested capital.
- My estimates consider all compensation adjustments in the valuation. I don’t believe adjusting Nu’s earnings for stock compensation is reasonable since this is a recurrent compensation.
- The revenue CAGR for the period is ~50% p.a. The stress scenario considered is that Nu will not grow its customers, only maturing the already existing ones.
The following image shows my estimates for Nu recurring cash earnings for 2026. I believe Nu will be able to convert 20% of its ARPAC into cash generation.

Observation for the estimated cash earnings is that the maintenance Capex (maintenance CAC) will represent ~17% of the ARPAC, especially if we’re estimating that the current clients base will remain constant throughout the following years.
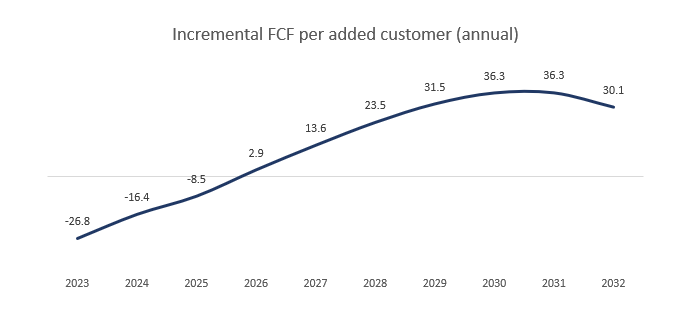
For Nu’s growth, I estimated the FCF generated by each cohort per incremental active customer and applied a 12% discount to it.
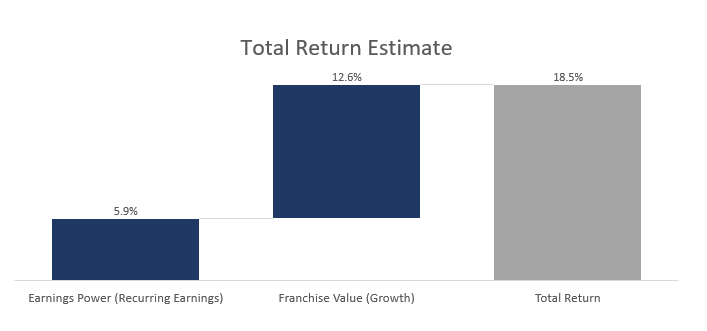
Therefore, considering an $8/sh price for Nu’s stock, my estimate suggests that Nu is trading an implied 18,5% return to equity over the foreseeable future, as the following illustration shows.
In the bear case scenario, where Nu grows only its ARPAC and considers 47mn active clients in the perpetuity, according to my estimates, Nu would be trading an implicit 9,2% total return over the foreseeable future.
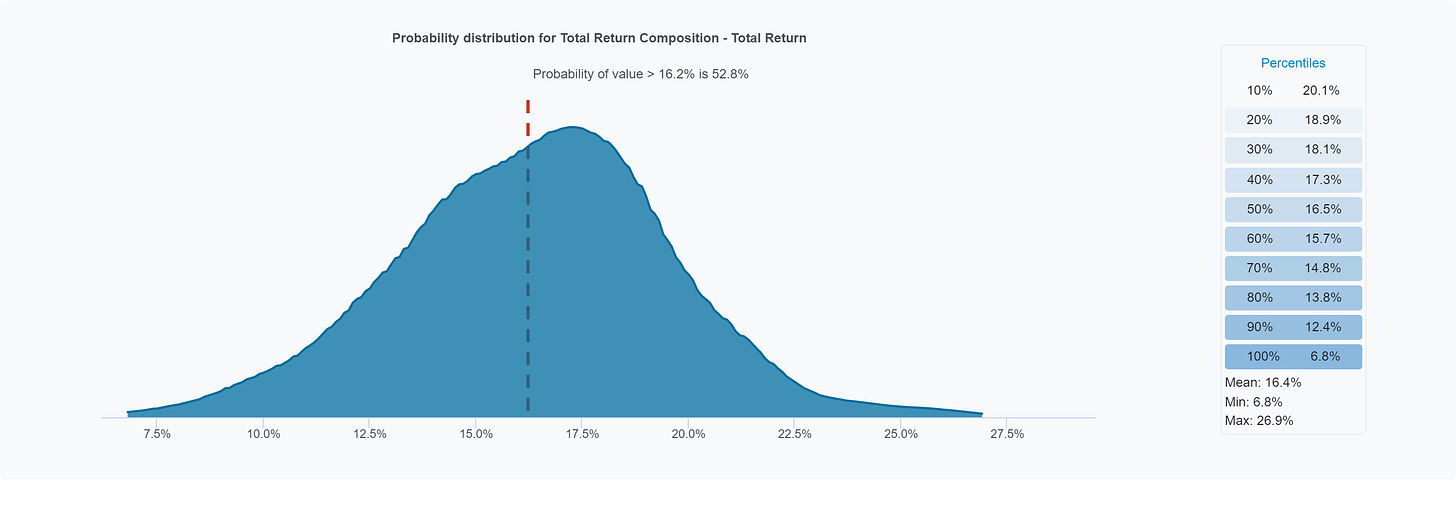
Finally, the Monte Carlo distribution is pretty decent (mostly normal variables, 1000 iterations. I considered both recurring earnings and growth earnings return for the simulation.
Final words
Thanks a lot if you read this far, even if you just skipped the writing to see my estimate return.
Please, share this post with friends and colleagues. It does help a lot.


