
Understanding the Difference: Profit V Revenue Explained for Investors
In the world of investing, grasping fundamental financial concepts is crucial for making informed decisions. Two terms that often cause confusion, especially for novice investors, are "profit v revenue." While both are essential indicators of a company's financial health, they represent very different aspects of a business's performance. This comprehensive guide will demystify these concepts, helping you analyze companies more effectively and make smarter investment choices.
What Is Revenue? The Top Line Explained
Revenue, often referred to as the “top line,” is the total amount of money a company generates from its core business operations before any expenses are deducted. It’s the first figure you’ll see on a company's income statement, giving you an immediate sense of the business’s scale. Revenue refers to the entire amount of income a business earns from its primary operations and other sources.
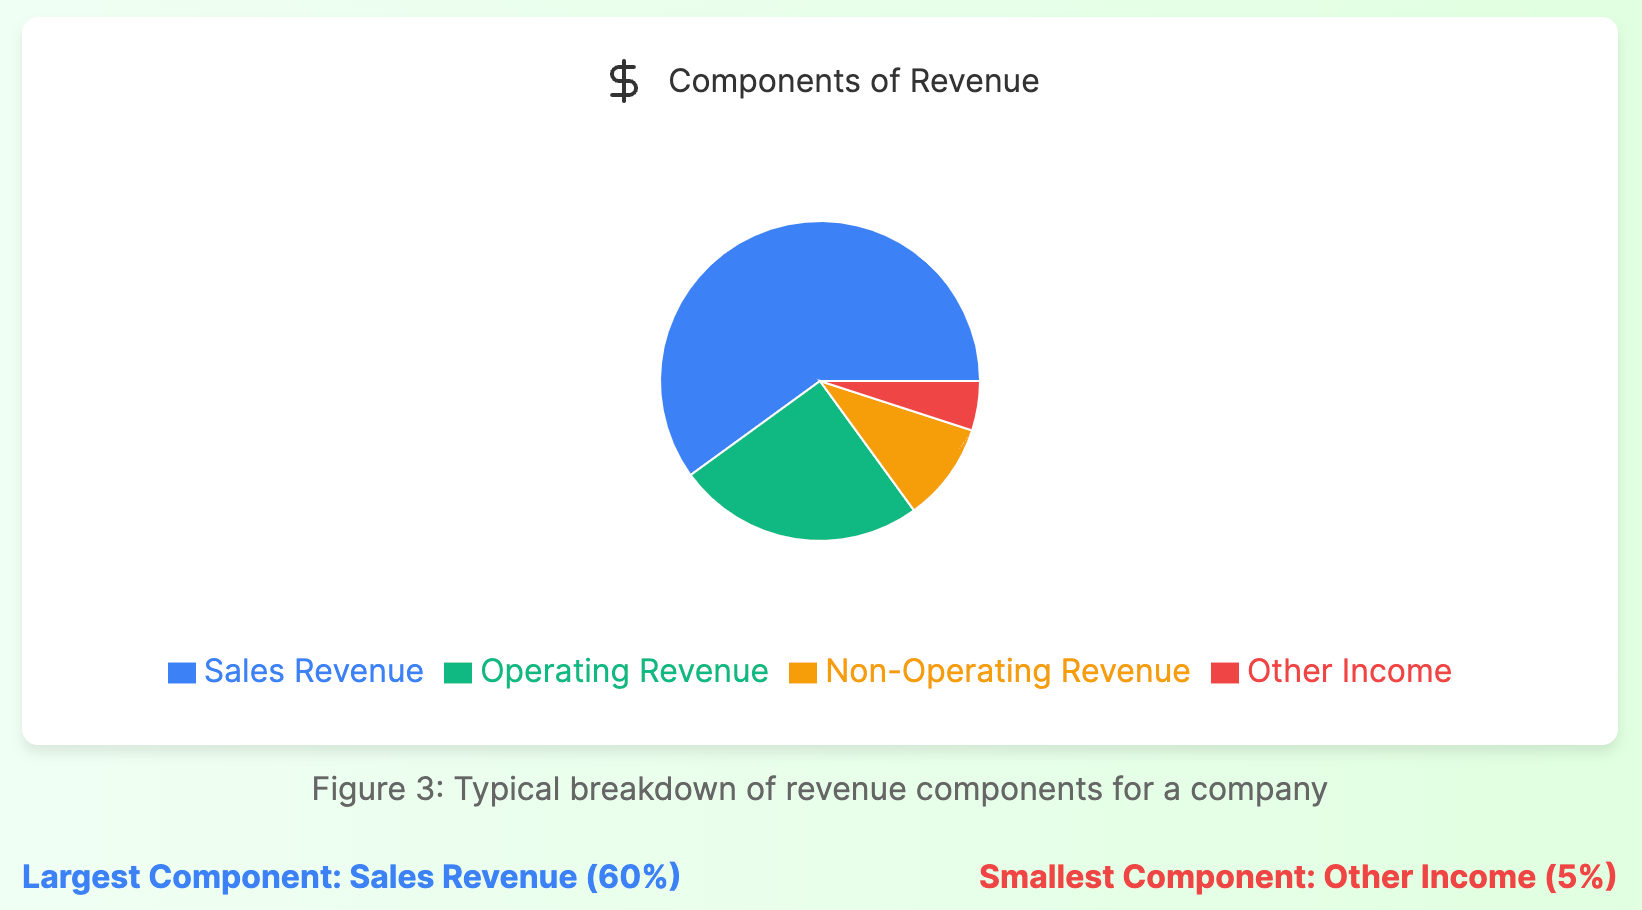
Components of Revenue
- Sales Revenue: Income generated from selling goods or services to customers.
- Operating Revenue: Income earned from a company's core business activities.
- Non-Operating Revenue: Income from secondary sources not related to the company's main business.
- Net Service Sales: Revenue generated specifically from providing services.
- Net Product Sales: Income earned from selling physical products.
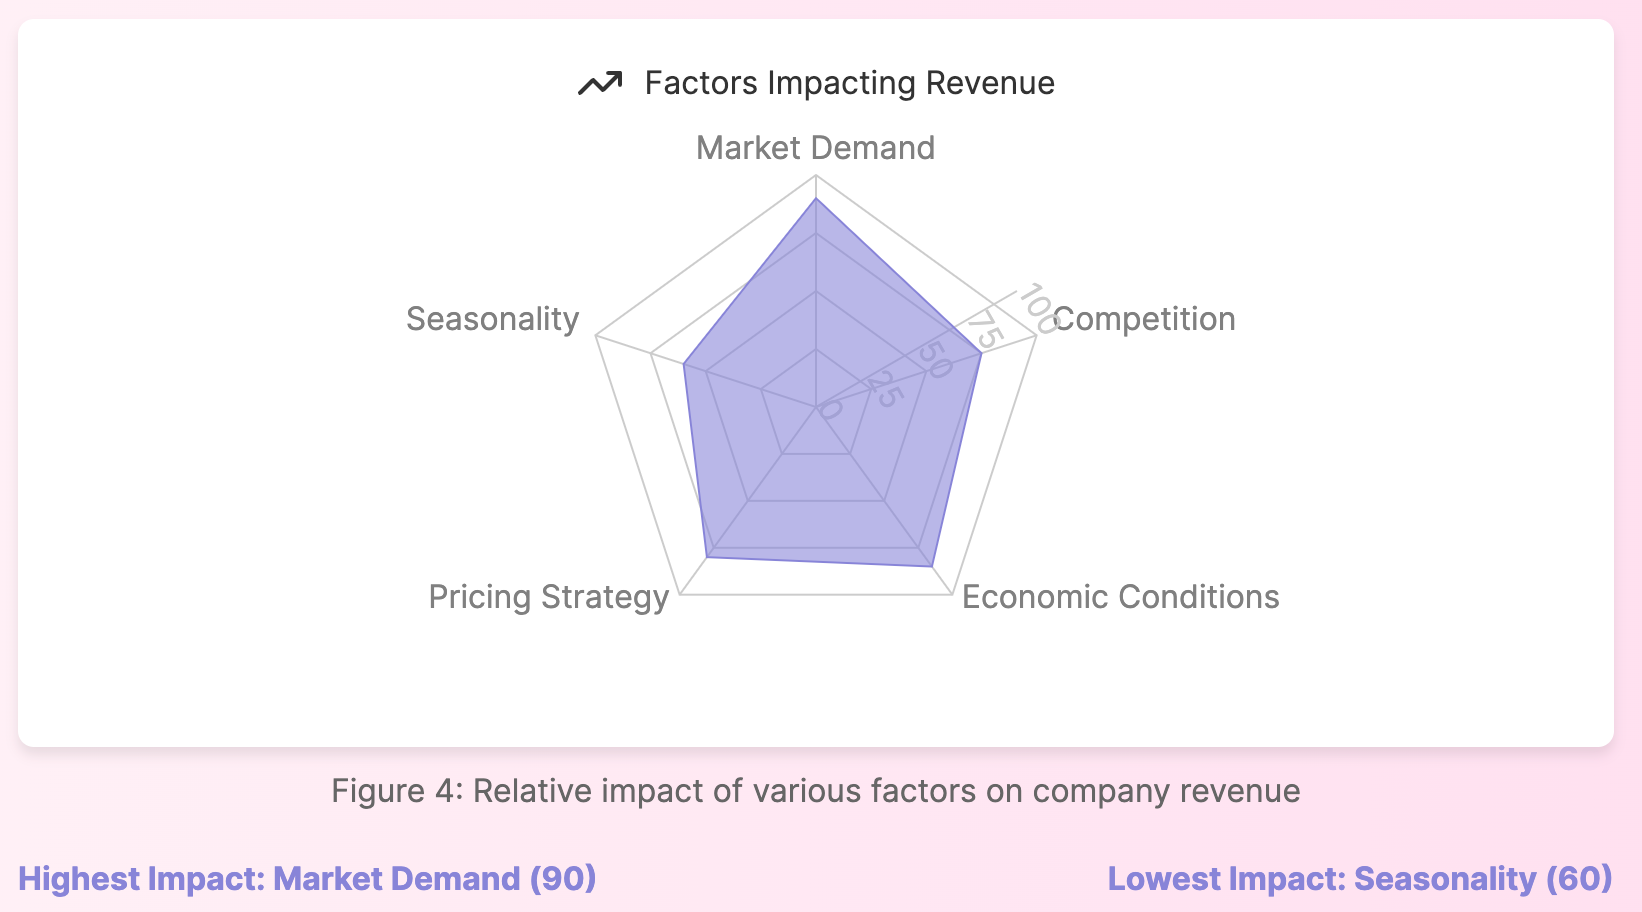
Factors Impacting Revenue
Several factors can influence a company's revenue:
- Market Demand: The level of consumer interest and need for the company's products or services.
- Competition: The presence and actions of rival companies in the same market.
- Economic Conditions: Overall economic health, including factors like GDP growth, inflation, and consumer spending.
- Pricing Strategy: The company's approach to setting prices for its goods or services.
- Seasonality: Fluctuations in demand based on time of year, particularly relevant in industries like retail and tourism.
Real-World Example: Apple's Record-Breaking Revenue
In fiscal year 2022, Apple Inc. (AAPL) reported a staggering annual recurring revenue of $394.33 billion. This figure represents the total revenue generated from sales of iPhones, Macs, iPads, services, and other products before accounting for any costs or expenses. Apple's revenue growth over the years showcases its ability to consistently expand its market reach and introduce successful new products.
What Is Profit? Unveiling the Bottom Line
Profit, also known as net income or the “bottom line,” represents the amount of money a company has left after subtracting all expenses from its revenue. This figure appears at the end of the income statement and is a key indicator of a company’s profitability and efficiency. Understanding profit is crucial for assessing a company’s financial performance and competitive positioning, as well as its overall financial health and company's financial position.
Types of Profit
- Gross and Operating Profit: Gross profit is calculated as revenue minus the cost of goods sold (COGS), while operating profit is gross profit minus operating expenses.
- Net Profit: The final profit figure after deducting all expenses, including taxes and interest expenses.
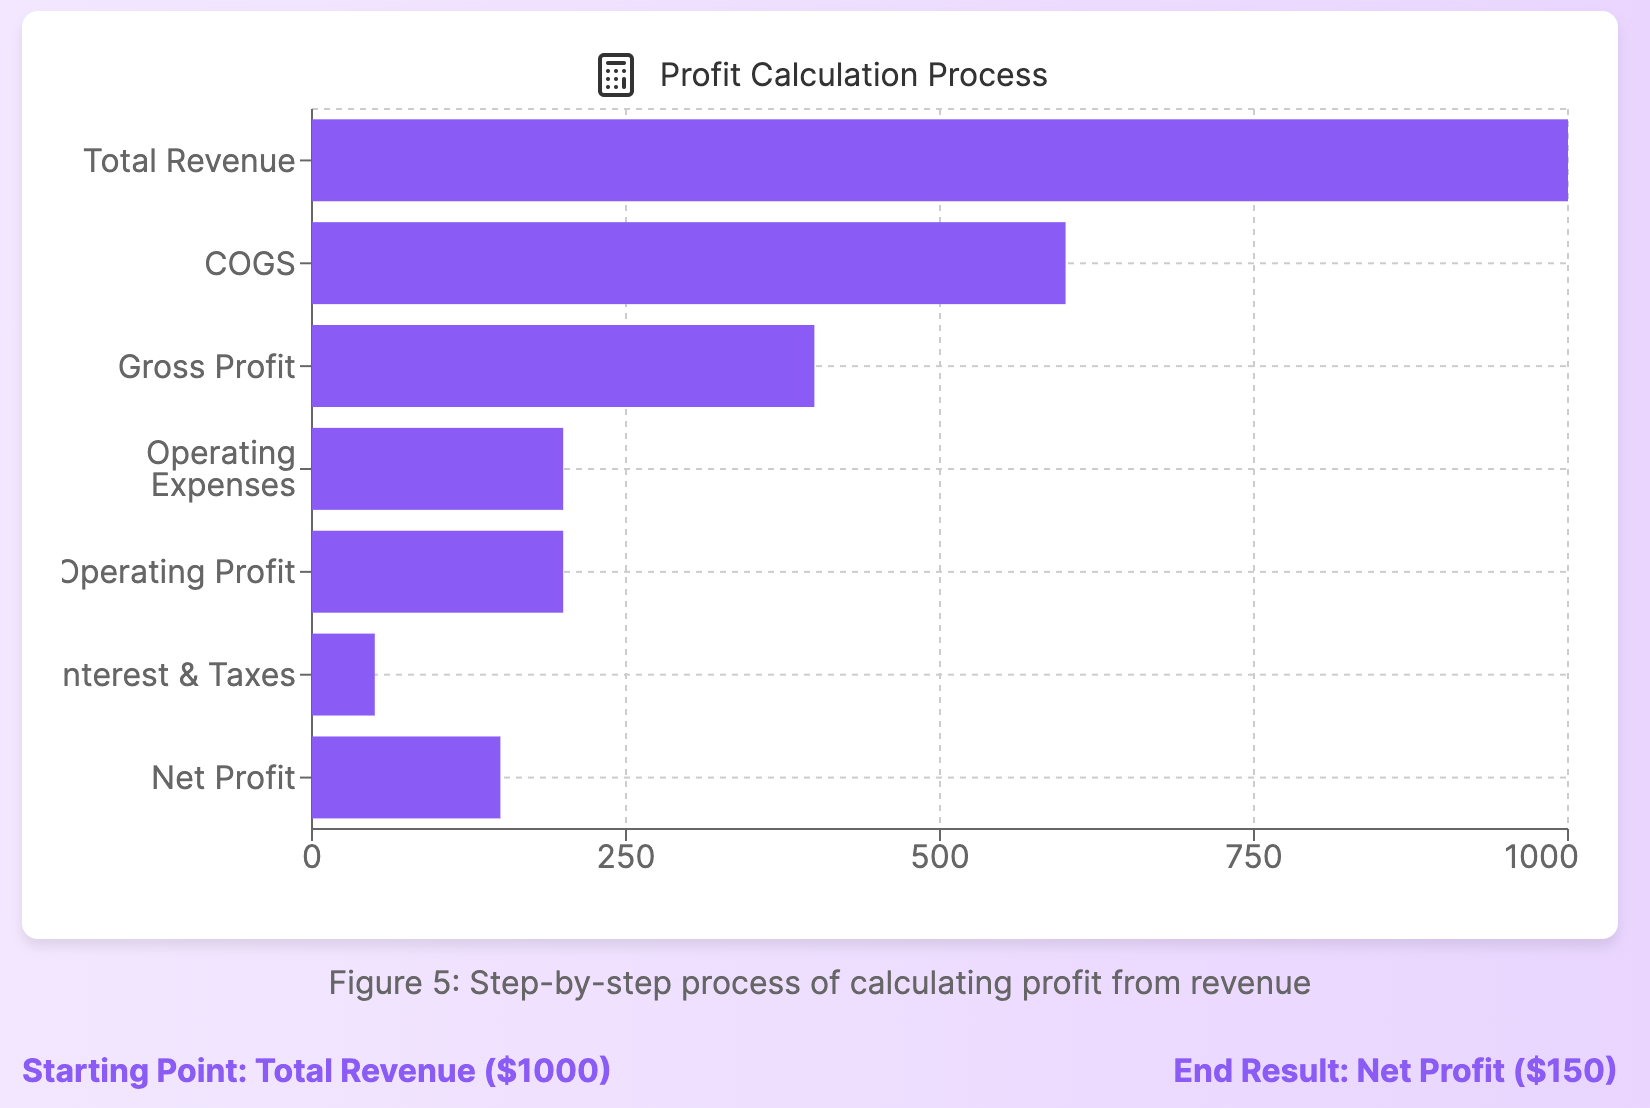
Calculating Profit: From Revenue to Net Income
To understand how companies arrive at their profit figures, let’s break down the calculation process:
- Start with Total Revenue
- Subtract Cost of Goods Sold (COGS), which includes direct costs such as materials and labor, = Gross Profit
- Subtract Operating Expenses = Operating Profit
- Subtract Interest Expenses
- Subtract Taxes Paid
- Result: Net Profit (Net Income)
This step-by-step process is reflected in a company’s income statement, providing investors with a clear picture of how efficiently the business turns revenue into profit.
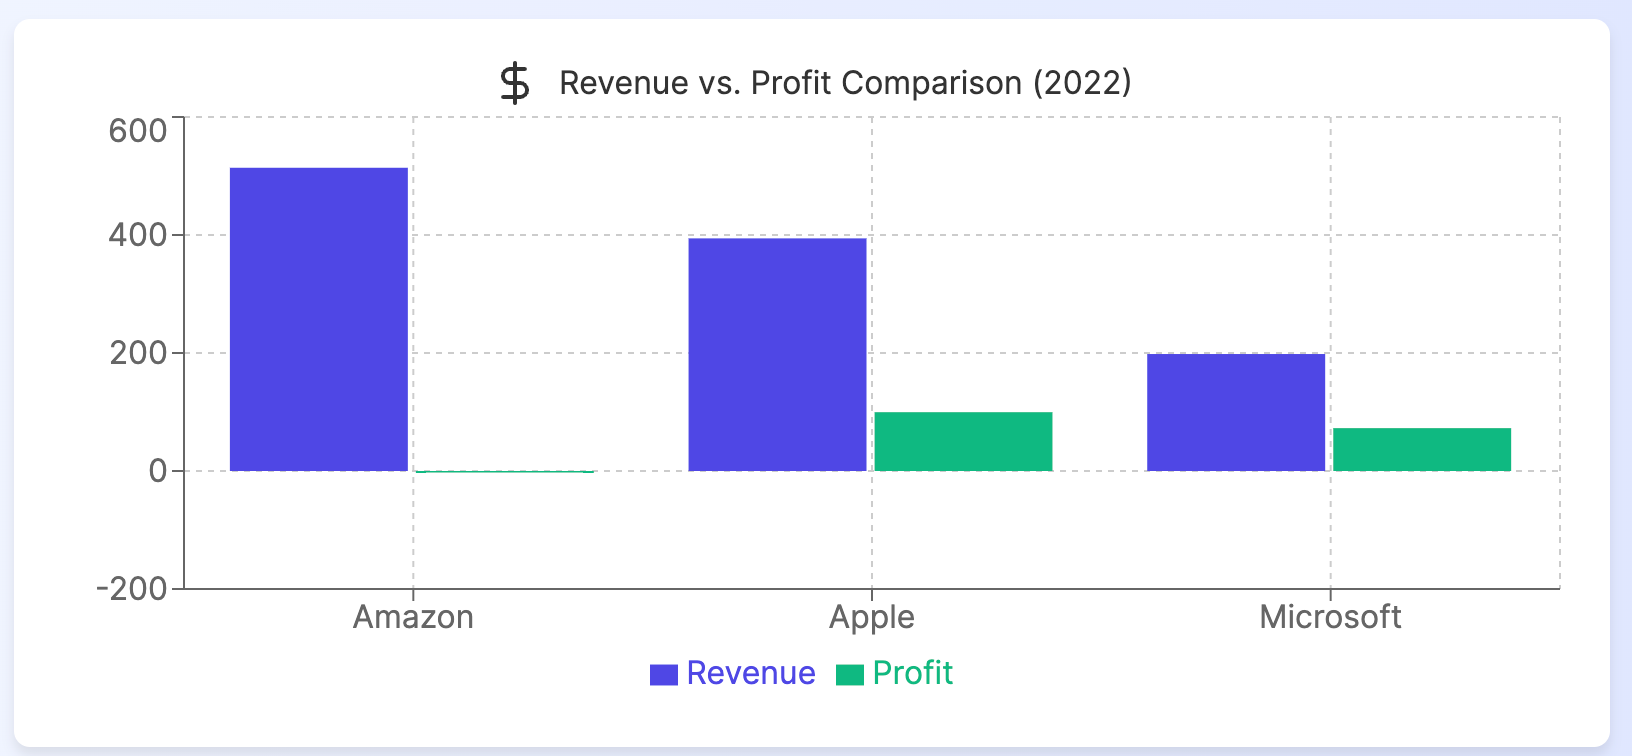
Real-World Example: Amazon's Revenue vs Profit
Amazon.com Inc. (AMZN) provides an excellent example of the difference between revenue and profit. In fiscal year 2022, Amazon reported:
- Total Net Sales (Revenue): $514.0 billion
- Net Income (Profit): $-2.7 billion (Net Loss)
Despite generating over half a trillion dollars in revenue, Amazon actually reported a net loss for the year. This showcases how a company can have massive sales but still struggle with profitability due to high operating costs, investments in growth, or other factors. Net profit accounts for all these expenses, taxes, and other financial considerations, illustrating the key difference between gross and net profit on an income statement.
Key Differences: Revenue vs Profit for Investors
Understanding the distinctions between revenue and profit is crucial for investors analyzing a company's financial health:
- Timing on Financial Statements: Revenue appears at the top of the income statement, while profit is the final figure at the bottom.
- Indication of Scale vs. Efficiency: Revenue indicates the size of a company's operations, while profit shows how efficiently it turns that revenue into earnings.
- Growth vs. Profitability: A company might have rapidly growing revenue but struggle with profitability, or vice versa.
- Cash Flow Implications: High revenue doesn't necessarily mean strong cash flow, while profit is more closely tied to cash generation.
- Investment Decisions: Some investors focus on high-growth companies with strong revenue growth, while others prefer established companies with consistent profits.
Profit Margins: A Key Metric for Investors
Profit margins, including net revenue, are crucial ratios that investors use to assess a company’s profitability relative to its revenue. There are three main types of profit margins:
- Gross Profit Margin: (Gross Profit / Revenue) x 100
- Indicates efficiency in production and pricing
- Operating Profit Margin: (Operating Profit / Revenue) x 100
- Shows profitability of core business operations
- Net Profit Margin: (Net Profit / Revenue) x 100
- Reveals overall profitability after all expenses
Industry Comparisons Using Profit Margins
Profit margins can vary significantly across industries. For example:
- Technology: Companies like Microsoft (MSFT) often have high profit margins due to scalable software products. In FY 2022, Microsoft's net profit margin was approximately 36.7%.
- Retail: Retailers like Walmart (WMT) typically have lower profit margins due to thin margins on physical goods. Walmart's net profit margin for FY 2023 was about 2.4%.
- Pharmaceuticals: Drug companies like Pfizer (PFE) can have high margins due to patent protection on novel drugs. Pfizer's net profit margin for 2022 was around 31.3%.

These differences highlight the importance of comparing companies within the same industry when assessing profitability.
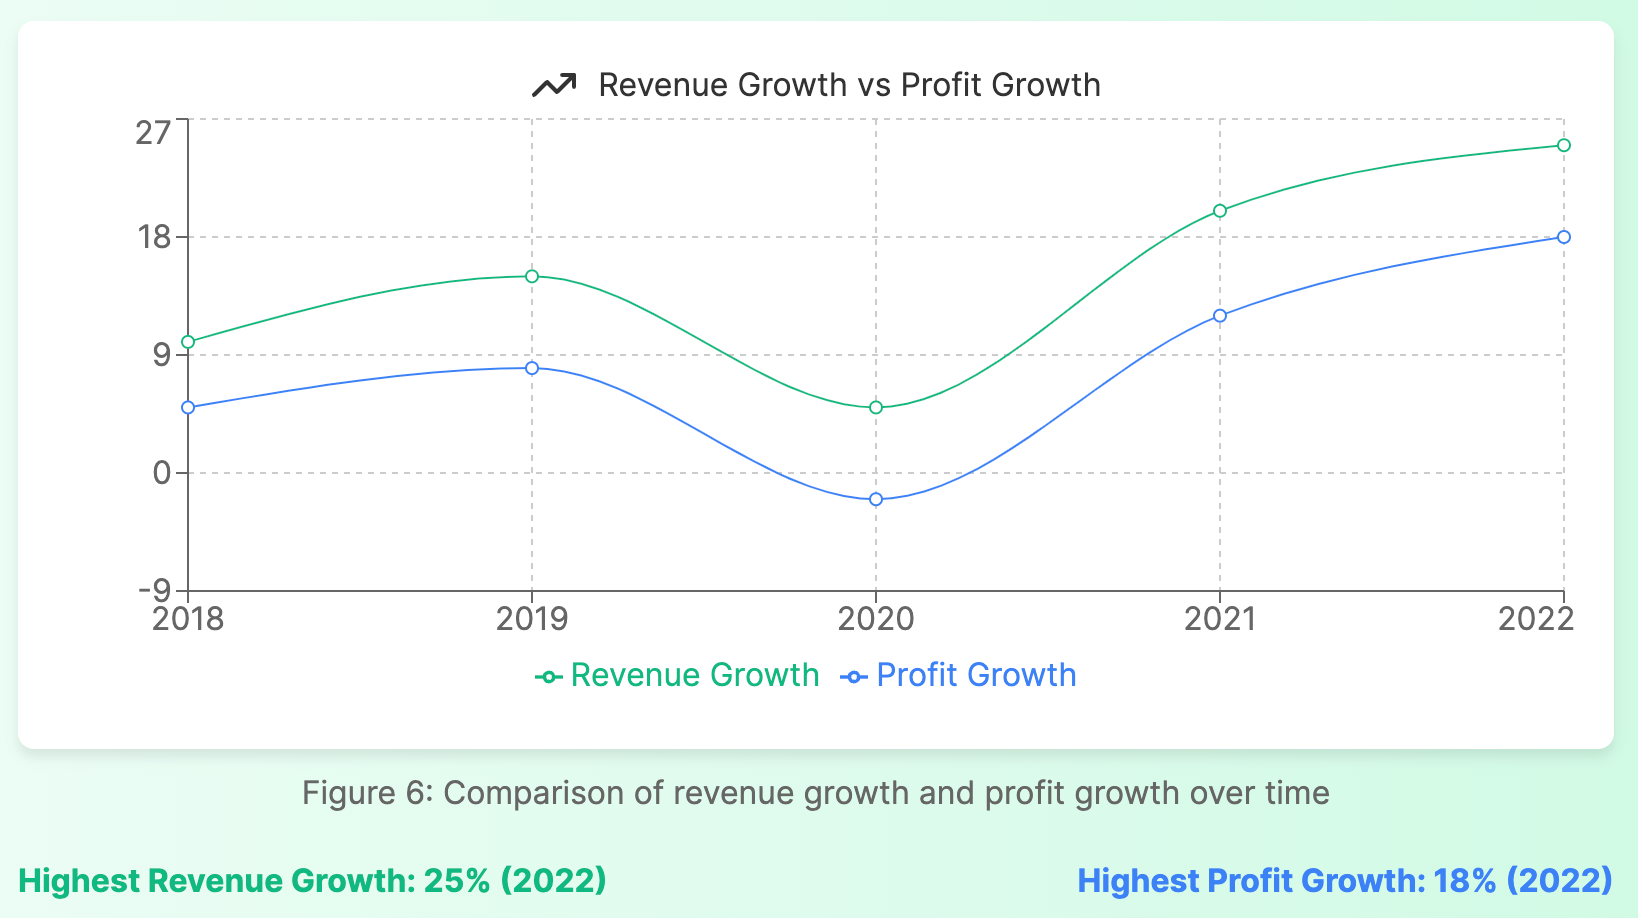
Revenue Growth vs. Profit Growth: What Matters More?
Both revenue growth and profit growth are important, but their relative importance can depend on a company's stage and an investor's strategy:
- Early-Stage Growth Companies: Often prioritize revenue growth to capture market share, even at the expense of short-term profitability. Example: Tesla (TSLA) in its early years focused on scaling production and sales rather than immediate profitability.
- Mature Companies: Usually expected to demonstrate both revenue growth and consistent profitability. Example: Apple (AAPL) is scrutinized for both its ability to grow sales and maintain high profit margins.
- Value Investing: Some investors focus more on consistent profitability and cash flow generation rather than rapid revenue growth. Example: Berkshire Hathaway (BRK.A) often invests in stable, profitable businesses rather than high-growth tech startups.
- Growth Investing: Other investors may prioritize companies with rapid revenue growth, betting on future profitability. Example: Many investors in Amazon (AMZN) over the years focused on its massive revenue growth and market dominance, despite inconsistent profitability.
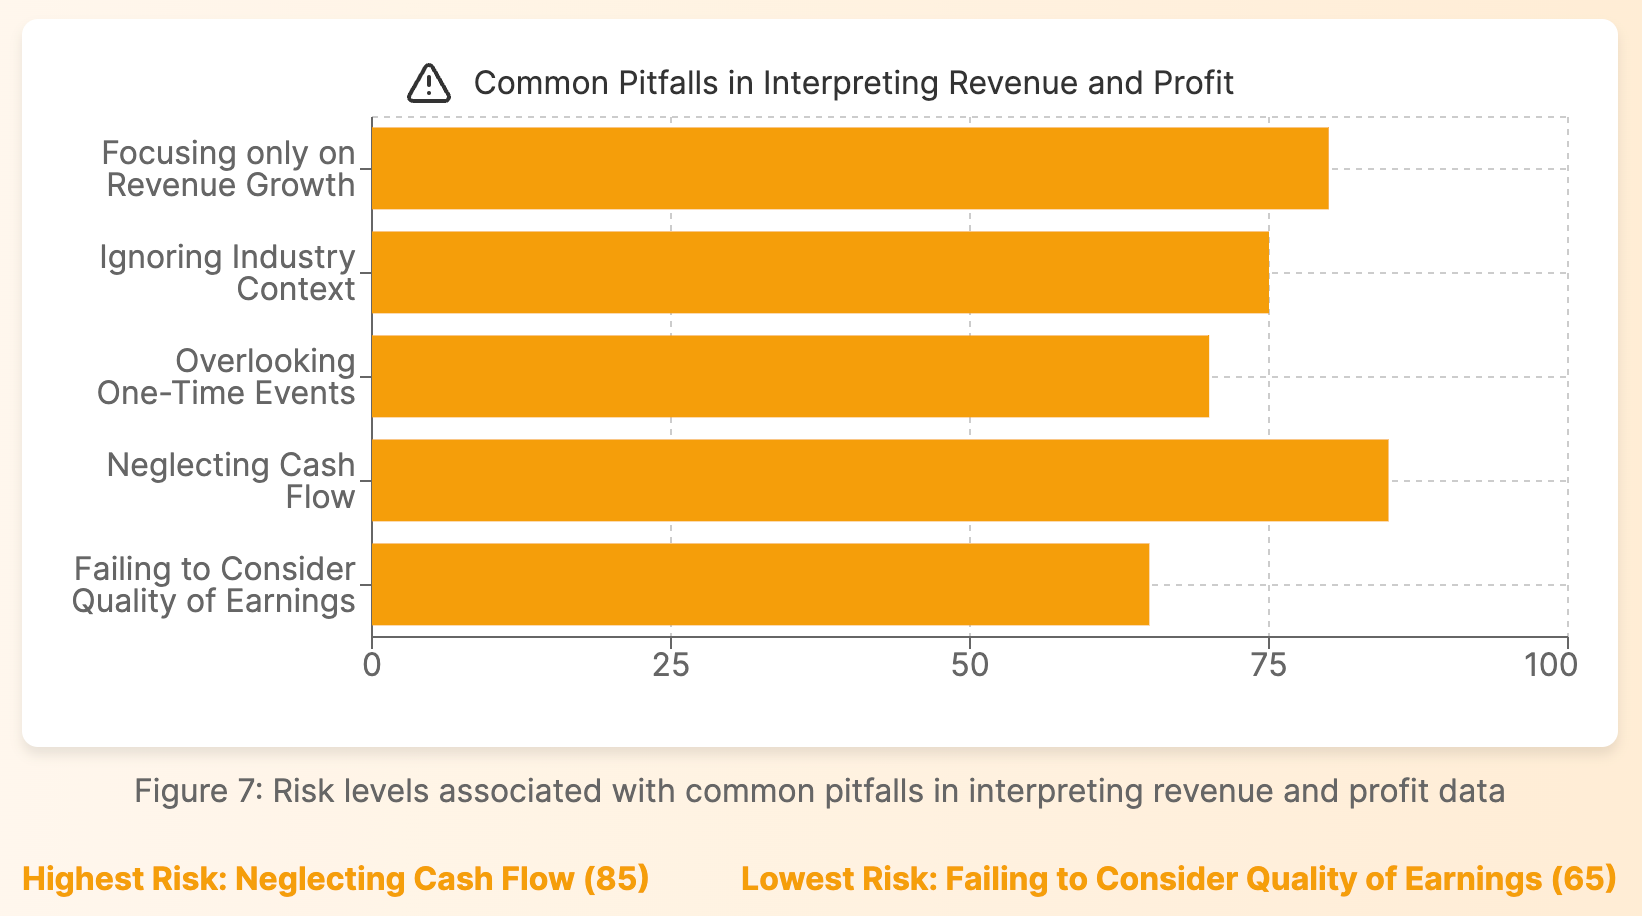
Common Pitfalls: Misinterpreting Revenue and Profit
Investors should be aware of several common mistakes when analyzing revenue and profit:
- Focusing Solely on Revenue Growth: High revenue growth doesn't guarantee future profitability or stock performance.
- Ignoring Industry Context: Profit margins that are excellent in one industry might be poor in another.
- Overlooking One-Time Events: Extraordinary items can significantly impact profit without reflecting the core business operations performance.
- Neglecting Cash Flow: A company can be profitable on paper but still face cash flow problems.
- Failing to Consider Quality of Earnings: Not all profits are created equal; some may be the result of accounting choices rather than genuine business improvement.
How Investors Can Use Revenue and Profit Data
To make the most of revenue and profit information, investors should:
- Analyze Trends: Look at revenue and profit growth over multiple years to identify patterns.
- Compare to Industry Peers: Assess how a company's revenue and profit metrics stack up against competitors.
- Examine Profit Margins: Track changes in gross, operating, and net profit margins over time.
- Consider the Business Model: Understand how the company generates revenue and turns it into profit.
- Look Beyond the Numbers: Read management's discussion and analysis to understand the context behind the figures.
- Use Multiple Valuation Metrics: Combine revenue and profit-based metrics (e.g., P/E ratio, PEG ratio, Price-to-Sales) for a more comprehensive valuation.
Conclusion: Balancing Revenue and Profit in Investment Decisions
Understanding the difference between revenue and profit is crucial for any investor looking to make informed decisions. While revenue provides insights into a company's market position and growth potential, profit ultimately determines the returns a company can generate for its shareholders.
By carefully analyzing both metrics, considering industry context, and looking at long-term trends, investors can gain a more comprehensive view of a company's financial health and future prospects. Remember, successful investing often involves looking beyond headline numbers to understand the true drivers of a business's success.
As you continue your investment journey, keep refining your ability to interpret financial data. The more adept you become at understanding concepts like revenue and profit, the better equipped you'll be to identify promising investment opportunities and avoid potential pitfalls in the market.
Frequently Asked Questions
Q: What is the difference between profit and revenue?
A: Revenue is the total amount of money a company generates from its business activities, while profit is what remains after deducting expenses from revenue. Revenue represents the top line on an income statement, while profit (or net income) is the bottom line. A company can have high revenue but low profit if its expenses are high.
Q: What is the difference between profit and gain?
A: Profit and gain are related but distinct concepts in finance:
- Profit typically refers to the financial benefit realized when the revenue from a business activity exceeds all relevant expenses and costs over a period of time. It's usually associated with ongoing business operations.
- Gain, on the other hand, often refers to a one-time increase in value or a positive difference realized from a specific transaction, such as selling an asset for more than its purchase price or book value.
For example, if a company sells products and the revenue exceeds all costs, that's profit. If the same company sells a piece of equipment for more than its depreciated value, that's a gain. Both contribute to a company's overall financial performance, but they're treated differently in accounting and have different implications for business analysis.
Q: Can a company have high revenue but low profit?
A: Yes, this is quite common, especially in industries with thin margins or for companies investing heavily in growth. Amazon, for many years, had enormous revenues but minimal profits as it reinvested in expansion. Factors that can lead to high revenue but low profit include:
- High operating costs
- Intense competition leading to price pressure
- Significant investments in research and development or expansion
- Inefficient operations or high overhead costs
- Economic factors affecting the cost of goods sold
Q: How can I tell if a company's revenue or profit growth is sustainable?
A: To assess the sustainability of a company's revenue or profit growth, consider:
- Historical trends: Look at growth patterns over several years.
- Industry comparisons: Compare growth rates to industry averages.
- Source of growth: Is it driven by factors like market expansion, new products, or improved efficiency?
- Economic context: Consider broader economic trends affecting the industry.
- Company strategy: Evaluate the company's long-term plans and competitive advantage.
- Quality of earnings: Analyze financial statements for any one-time events or accounting changes that might artificially inflate growth.
- Customer diversification: A diverse customer base often indicates more sustainable growth.
- Market saturation: Assess how much room for growth remains in the company's primary markets.
Sustainable growth is usually driven by factors like expanding market share, introducing successful new products, or improving operational efficiency, rather than one-time events or unsustainable practices.


