
Introduction: The Hidden Gem of Financial Metrics
In the vast ocean of financial ratios and metrics, Return on Invested Capital (ROIC) stands out as a beacon for savvy investors and analysts. But what makes ROIC so special, and why should you care about it? Let's dive deep into the world of ROIC and discover how this powerful tool can transform your approach to financial analysis and investment decision-making.
What is ROIC? Breaking Down the Basics
Return on Invested Capital is a financial metric that measures how efficiently a company uses its capital to generate profits. It serves as a report card for how well a company's management team utilizes the money invested in the business. ROIC isn't just another number on a financial statement; it's a window into a company's operational efficiency and value creation potential.
The essence of ROIC lies in its ability to tell you how much profit a company generates for every dollar invested in its operations. This insight is invaluable for investors seeking to identify companies that can create sustainable value over time.
How is ROIC Calculated?
Now that we understand what return on invested capital represents, let's break down the formula:
ROIC = Net Operating Profit After Tax (NOPAT) / Invested Capital
Where:
- NOPAT = EBIT × (1 - Tax Rate)
- Invested Capital = Total Assets - Current Liabilities - Cash and Cash Equivalents
Pro Tip: Some analysts use average invested capital over a period to smooth out fluctuations.
How Do You Calculate ROIC? A Step-by-Step Guide
Let's walk through a real-world example to illustrate how to calculate ROIC:
Imagine Company XYZ has the following financial data:
- EBIT: $100 million
- Tax Rate: 25%
- Total Assets: $800 million
- Current Liabilities: $200 million
- Cash and Cash Equivalents: $50 million
Step 1: Calculate NOPAT NOPAT = $100 million × (1 - 0.25) = $75 million
Step 2: Calculate Invested Capital Invested Capital = $800 million - $200 million - $50 million = $550 million
Step 3: Calculate ROIC ROIC = $75 million / $550 million = 0.1364 or 13.64%
What is a Good ROIC Ratio?
Now that we've calculated ROIC, what does 13.64% actually tell us? Here's how to interpret ROIC:
- Generally, a higher ROIC is better, indicating more efficient use of capital.
- Compare ROIC to the company's Weighted Average Cost of Capital (WACC):
- If ROIC > WACC: The company is creating value
- If ROIC < WACC: The company is destroying value
- Industry context matters: A 13.64% ROIC might be excellent in one industry but mediocre in another.
Evaluating the capital invested capital return
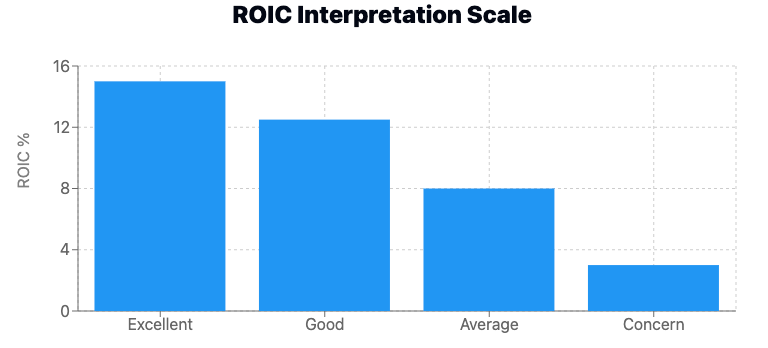
A good return on invested capital varies by industry and company size. However, as a general rule:
- ROIC above 15% is considered excellent
- ROIC between 10-15% is good
- ROIC between 6-10% is average
- ROIC below 6% may be cause for concern
Remember, it's crucial to compare a company's return on invested capital to its industry peers and historical performance for a more accurate assessment.
What Does a 50% ROIC Mean?
A 50% return on invested capital is exceptionally high and indicates that the company is generating $0.50 of profit for every dollar of invested capital. This level of efficiency is rare and often suggests a strong competitive advantage or a highly scalable business model. However, it's essential to verify the sustainability of such a high ROIC and understand the underlying factors contributing to this impressive performance.
ROIC vs. Other Financial Metrics: The Showdown
To fully appreciate the value of ROIC, it's helpful to compare it with other popular financial metrics like Return on Equity (ROE) and Return on Assets (ROA).
ROIC differs from ROE in that it considers all invested capital, not just book value. This makes ROIC less susceptible to changes in capital structure, providing a clearer picture of operational efficiency, considering the net operating assets, such as the net working capital and fixed assets – or shareholders equity with the net debt.
Compared to ROA, ROIC focuses specifically on operating profits and invested capital, excluding non-operating assets and net income which ROA includes.
Another metric often confused with ROIC is Return on Capital Employed (ROCE). While similar, ROCE uses operating income (EBIT) in its calculation, whereas ROIC uses after-tax profit (NOPAT), considering the income taxes.
Additionally, ROCE's definition of capital may differ slightly from ROIC's invested capital. Despite these differences, both metrics aim to measure capital efficiency, with ROIC often preferred for its focus on core operating performance and consideration of tax impacts on operating income.


The Power of ROIC in Investment Analysis
Investors should care about ROIC for several compelling reasons. Consistently high return on invested capital often indicates a strong competitive advantage, making it a valuable tool for identifying quality companies. ROIC also reflects how well management allocates capital, providing insight into management effectiveness.
Moreover, companies with higher ROIC tend to outperform in the long run, making it a useful predictor of long-term performance. The metric also facilitates comparative analysis, allowing investors to compare companies across different industries and capital structures.
Despite its power, ROIC is not without limitations. Its relevance can vary by industry, with capital-intensive sectors often showing lower ROIC figures. Accounting practices can distort ROIC calculations, and the metric might not fully capture the value of long-term investments. Additionally, ROIC uses book values, which may not always reflect true economic value.
Leveraging on Net Operating Profit: Real-World Case Studies
Let's examine how ROIC plays out in real companies:
Case Study 1: Tech Giant vs. Traditional Retailer
- Tech Company A: ROIC of 25%
- Retailer B: ROIC of 12%
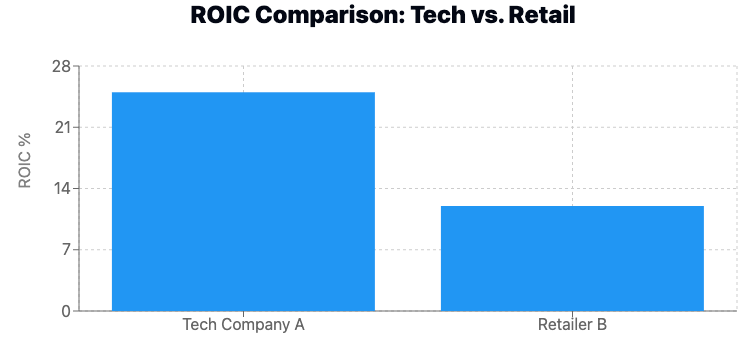
Analysis: While Retailer B's ROIC might seem low compared to Tech Company A, it could actually be impressive for the retail industry. Context is key!
It's much harder for retail companies to achieve profitable projects. For the business' balance sheet, they require more capital employed in the operation to generate returns in a more competitive business, which offers fewer economic benefits and profitable investments than a low-competitive industry.
Case Study 2: The Turnaround Story
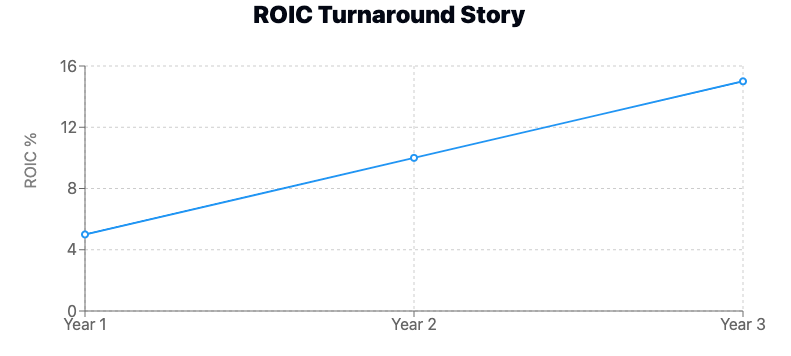
- Company C: ROIC increased from 5% to 15% over three years
Analysis: This significant improvement in ROIC could indicate successful management initiatives and improving operational efficiency over a given period. This efficiency can be achieved through balance sheet or income statement improvements, such as working capital efficiency, or higher margins could improve a company's ROIC.
Advanced ROIC Techniques: Taking It to the Next Level
For those ready to dive deeper, consider these advanced ROIC applications:
- ROIC Decomposition: Break ROIC into its components (profit margin and capital turnover) for more granular analysis.
- ROIC Forecasting: Project future ROIC to estimate a company's long-term value creation potential.
- ROIC and Valuation: Incorporate ROIC into discounted cash flow (DCF) models for more accurate company valuations.
How is ROIIC calculated?
Return on Incremental Invested Capital (ROIIC) is a crucial metric that helps investors and analysts evaluate the efficiency of a company's efficiency in its new investments. Unlike ROIC, which measures the overall return on all invested capital, ROIIC focuses specifically on the returns generated from additional capital investments. This makes it an invaluable tool for assessing a company's growth prospects and capital allocation decisions.
To calculate ROIIC, we use the following formula:
ROIIC = Incremental NOPAT / Incremental Invested Capital
Let's break this down:
- Incremental NOPAT (Net Operating Profit After Tax) is the additional after-tax operating profit generated from new investments. It's calculated by subtracting the previous period's NOPAT from the current period's NOPAT found in the income statement.
- Incremental Invested Capital represents the additional capital invested in the business. It's determined by subtracting the previous period's invested capital from the current period's invested capital in the balance sheet.
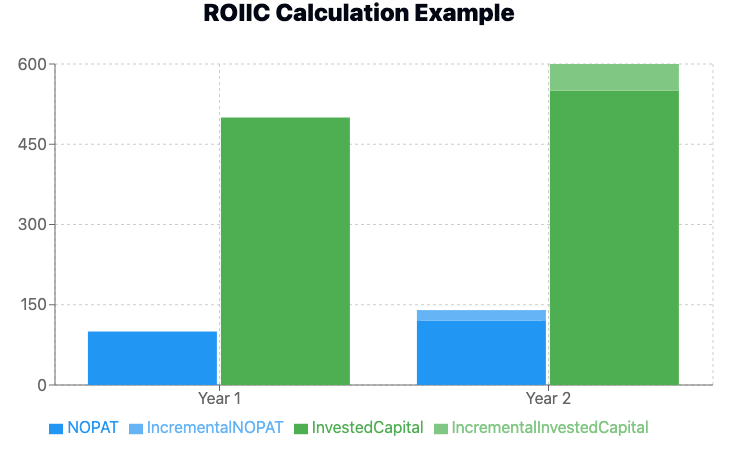
For example, let's say Company A had the following figures:
Year 1: NOPAT: $100 million Invested Capital: $500 million
Year 2: NOPAT: $120 million Invested Capital: $550 million
To calculate ROIIC:
Incremental NOPAT = $120 million - $100 million = $20 million Incremental Invested Capital = $550 million - $500 million = $50 million
ROIIC = $20 million / $50 million = 0.4 or 40%
This 40% ROIIC indicates that the company's new investments are generating a 40% return, which is quite impressive, and should reflect in the company's market value. It suggests that the company is making efficient use of its additional capital to drive growth.
ROIIC is particularly useful for companies in growth phases or those undertaking significant expansion projects. A high ROIIC suggests that a company can profitably reinvest in its business, potentially leading to sustained growth and value creation. Conversely, a low or declining ROIIC might indicate that a company is struggling to find profitable investment opportunities, which could be a red flag for investors.
When analyzing ROIIC, it's important to consider it alongside other metrics and over multiple periods. A single year's high ROIIC might be an anomaly, while consistently high ROIIC over several years can indicate a sustainable competitive advantage and effective capital allocation strategies.
ROIC and Average Invested Capital: The Warren Buffett Perspective
Warren Buffett, the legendary investor, places great importance on ROIC when assessing companies. He looks for businesses with consistently high ROIC as an indicator of a durable competitive advantage or "economic moat."
Buffett's Wisdom: "The best businesses by far for owners continue to be those that have high returns on capital and that require little incremental investment to grow."

Conclusion: Harnessing the Power of Return on Invested Capital
Return on Invested Capital is more than just a financial ratio – it's a powerful lens through which to view a company's operational efficiency and value creation potential. By mastering ROIC, investors equip themselves with a tool that can significantly enhance their investment analysis and decision-making process.
Remember, while ROIC is invaluable, it's just one piece of the puzzle. Always consider it alongside other financial metrics, industry trends, and qualitative factors for a holistic view of a company's performance and prospects. As you apply your ROIC knowledge to analyze companies in your investment portfolio, you might be surprised by the insights you uncover, potentially transforming your approach to financial analysis and investment decision-making.


