
The valuation of the S&P 500 index is a focal point for concern among investors, analysts, and market commentators, given the current high levels that suggest potential overvaluation. As of the latest data, the S&P 500's price-to-earnings (P/E) ratio presents a nuanced picture of the market's current state. This section delves into the current valuation metrics, comparing them to historical averages and interpreting what these figures might imply for future market performance, raising caution flags where appropriate.
Overview of Current Valuation Metrics
Current valuations are higher than 90% of historical observations, indicating a relatively expensive market. This raises concerns about future returns and the sustainability of these high valuations.
The aggregate P/E ratio of the S&P 500 has experienced significant expansion over the past year. As of the latest posts, the aggregate P/E has risen from 17x in late October to 21x, placing it in the 90th percentile since 1985. This indicates that current valuations are higher than 90% of historical observations over the past several decades, suggesting a market that is relatively expensive compared to its historical norms. Historically, such elevated P/E ratios have often preceded periods of market corrections or reduced returns, raising concerns about potential overvaluation.
In addition to the aggregate P/E, the equal-weighted S&P 500 (SPW) P/E ratio has also seen a notable increase, rising from 14x to 17x. This places it in the 92nd percentile since 1985, underscoring a broad-based expansion in valuations across the index. The equal-weighted metric provides a more balanced view, as it gives equal importance to each constituent, thereby highlighting valuation trends that may be less visible in a cap-weighted analysis dominated by larger companies.
Comparing these figures with historical averages is essential to putting these figures into perspective. Historically, the S&P 500's median P/E ratio has hovered around 15x. The current aggregate P/E ratio of 21x thus represents a significant premium to this median, while the equal-weighted P/E ratio of 17x is similarly elevated relative to its historical average.
The implications of these elevated ratios are multifaceted. On one hand, high P/E ratios can signal investor optimism about future earnings growth and economic conditions. On the other hand, they also suggest that the market may be overvalued, potentially setting the stage for more modest future returns or even a correction if earnings fail to meet these elevated expectations.
Earnings Review
While the expected EPS for 2024 and beyond shows a solid upward trend, it's crucial to consider that such optimistic projections may not fully materialize, particularly in a non-crisis economic environment.
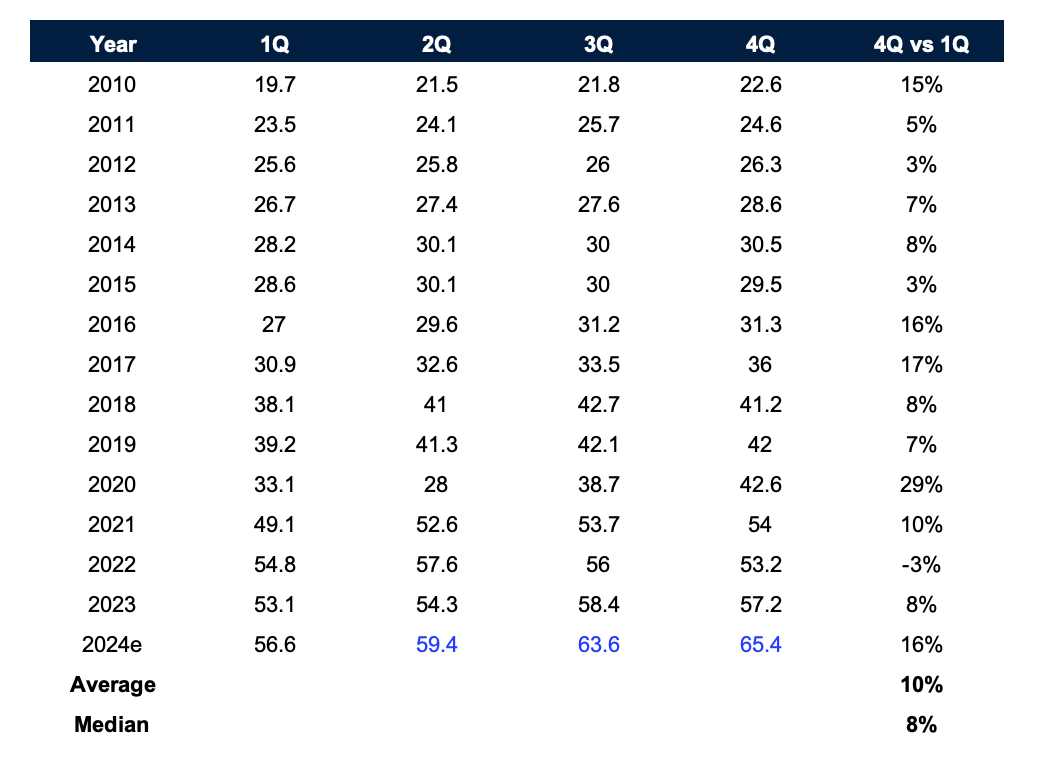
Recent estimates for the S&P 500 earnings provide critical insights into the index's valuation. These projections indicate a solid upward trend in earnings expectations over the next few years. Notably, after the 1Q24 earnings season, the expected EPS for 2024 has increased from 221 to 244.7 (+10.7%), for 2025 from 241 to 276.6 (+14.8%), and for 2026 from 264 to 300.4 (+13.8%). This positive outlook supports the elevated P/E ratios, as investors anticipate robust earnings growth to justify the high valuations.
However, this year's projected Q4 growth appears exceptionally optimistic, a pattern typically seen only in years following deep economic crises, which is not the current scenario. This raises concerns about whether these high expectations are realistic and sustainable.
The following chart highlights the Magnificent 7's (Mag7) significant influence on the S&P 500's overall earnings growth. The Mag7's robust performance is a key driver behind the index's earnings growth, underscoring the impact of these leading tech companies on the broader market valuation.
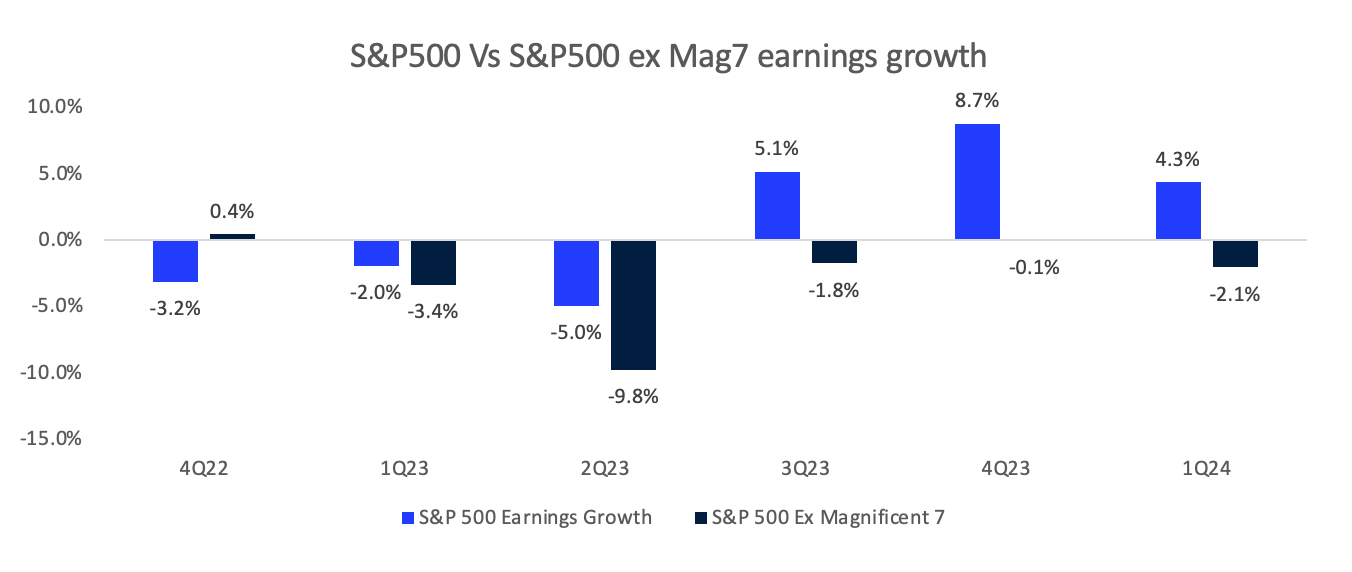
While these projections are promising, it's essential to remain cautious. The heavy reliance on a few key players introduces vulnerability to the market. If these companies fail to meet their earnings expectations, the broader market could experience significant volatility.
Fair Value Estimations
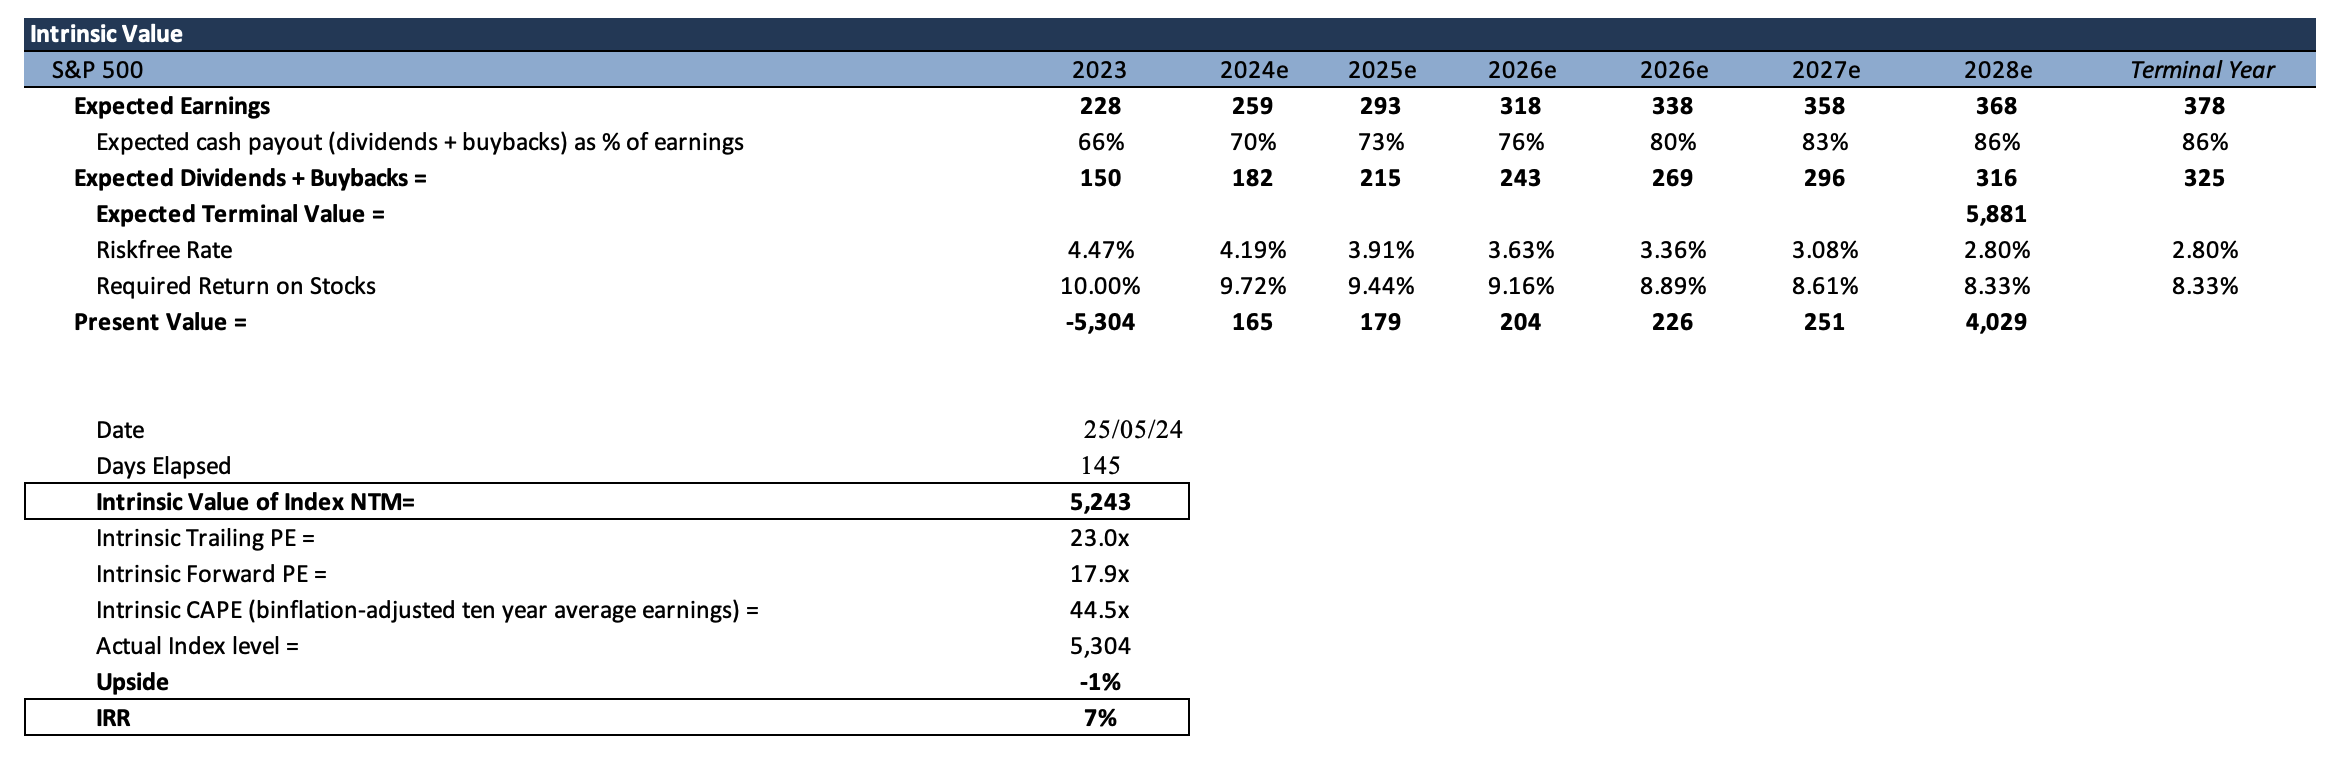
An estimated fair value for the S&P 500 is projected at 5,243 over the next twelve months (NTM). This valuation is derived from three key components:
- Sell-side review estimates for S&P earnings for the following three years: These provide a forward-looking view of the potential earnings trajectory for the index.
- P/E level based on the earnings payout (dividends + buybacks): This approach considers the proportion of earnings returned to shareholders, directly impacting the intrinsic value of the index.
- Macroeconomic indicators: New Orders growth, the BAA Spread, the 10s2s spread, and the unemployment rate provide a comprehensive view of the economic environment that can affect corporate earnings and market valuations.
This valuation model aligns the fair value P/E for the S&P 500 with these estimates and macroeconomic factors. The model incorporates expected earnings growth, dividend and buyback payout ratios, and various economic indicators influencing investor sentiment and market performance. Based on these inputs, the estimated fair value of 5,243 for the S&P 500 reflects a balanced view of current and future market conditions. While this estimation is grounded in positive economic projections and robust earnings growth, it also accounts for potential risks from macroeconomic uncertainties.
Historical data suggests that immediate market declines do not necessarily follow periods of overvaluation. For instance, past episodes where the S&P 500 P/E ratio was similarly elevated have typically seen continued market gains over the subsequent 3, 6, and 12-month periods, albeit with below-average returns. This pattern indicates that while the market may be expensive, it can remain so for extended periods, mainly if supported by a robust economic growth environment.
The current state of S&P 500 valuations presents a mixed bag for investors. On one hand, the high P/E ratios reflect optimism about future earnings and economic resilience. On the other hand, they also signal potential risks if the anticipated growth does not materialize.
Investors should remain vigilant and consider the broader economic context when interpreting these valuation metrics. Factors such as interest rates, inflation expectations, and economic growth projections will play crucial roles in determining whether current valuations are sustainable or if adjustments are on the horizon.
In conclusion, while the S&P 500 appears fairly priced by some metrics, it also shows signs of overvaluation compared to historical norms. This duality underscores the importance of a balanced investment approach, combining optimism about future growth with caution about potential downside risks.
Economic Growth and Market Expectations
Despite robust GDP growth projections, the possibility of these growth expectations already being priced into the market introduces significant downside risks. Understanding the interplay between economic growth and market expectations is crucial when assessing the valuation of the S&P 500. This section explores the outlook for economic growth, its impact on market performance, and the sentiment and positioning of investors that shape current valuations.
Economic Growth Outlook
The foundation of any stock market valuation rests on the health and trajectory of the broader economy. For 2024, the economic outlook appears robust, with forecasts for real US GDP growth remaining optimistic. According to Goldman Sachs, their economists expect real US GDP growth to exceed consensus forecasts, projecting an annual average growth rate of 2.8%. This strong growth backdrop underpins the elevated valuations in the S&P 500 as investors price in continued economic expansion and corporate earnings growth.
The relationship between economic growth and market performance is well-documented. During periods of strong economic growth, corporate earnings tend to rise, justifying higher stock valuations. Conversely, economic slowdowns often lead to earnings disappointments and market corrections. Therefore, the optimistic growth projections are essential to the S&P 500's valuation.
Investor Sentiment and Positioning
Investor sentiment and market positioning provide additional layers of insight into the valuation dynamics of the S&P 500. Recent trends indicate a shift towards greater caution regarding the strength of the US economy, which is reflected in the relative performance of cyclical stocks versus defensive stocks.
The provided chart shows the performance ratio of cyclical sector ETFs, such as the Industrial Select Sector SPDR Fund (XLI), the Consumer Discretionary Select Sector SPDR Fund (XLY), and the Financial Select Sector SPDR Fund (XLF), compared to defensive sector ETFs, such as the Consumer Staples Select Sector SPDR Fund (XLP), the Health Care Select Sector SPDR Fund (XLV), and the Utilities Select Sector SPDR Fund (XLU). The chart indicates a downward trend, suggesting that defensive sectors outperform cyclical ones.
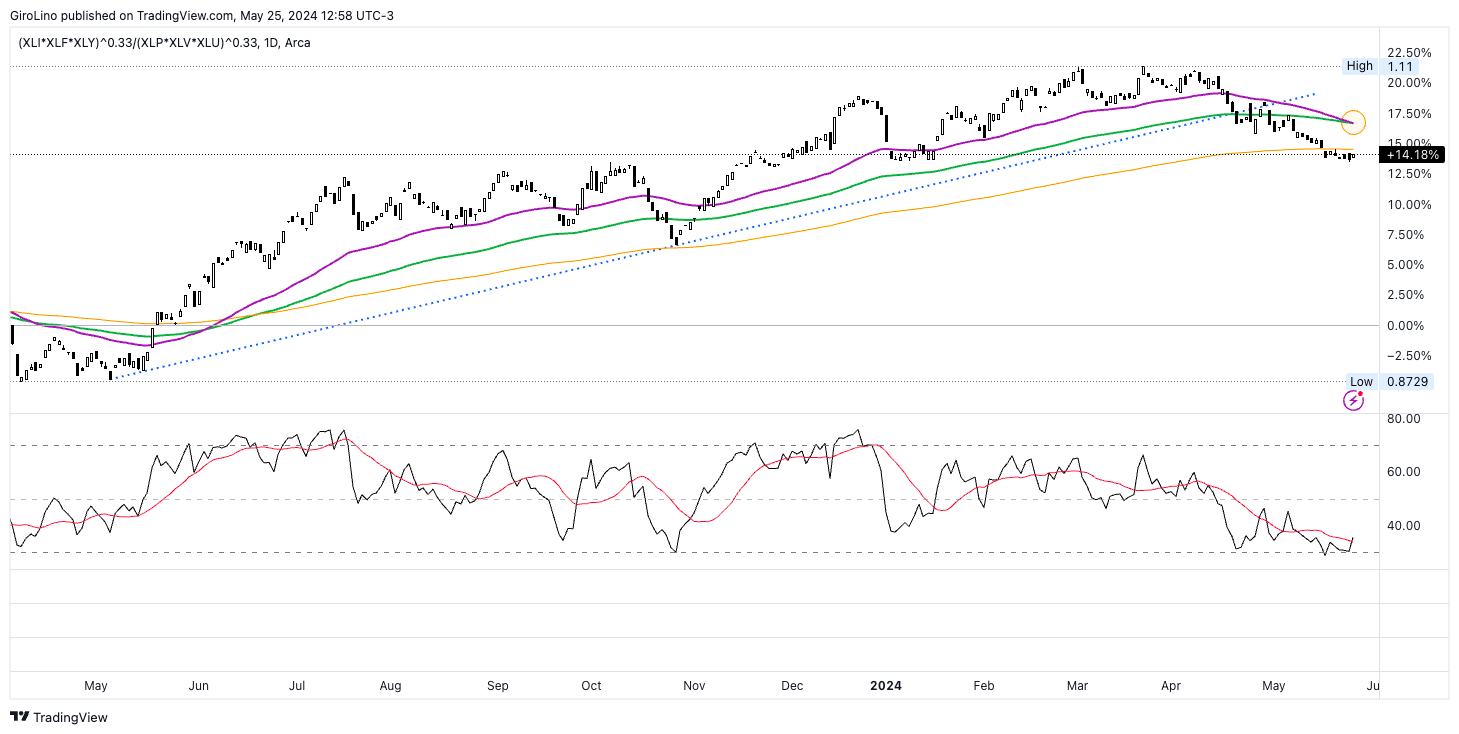
Cyclical stocks, which include sectors like industrials, consumer discretionary, and financials, are typically more sensitive to economic fluctuations. Their recent underperformance suggests that investors are becoming more risk-averse, favoring defensive stocks perceived as safer during periods of economic uncertainty. This shift in sentiment indicates concerns about potential economic headwinds and the sustainability of current growth trends.
By understanding these shifts in investor sentiment and market positioning, investors can better interpret the valuation dynamics of the S&P 500 and adjust their strategies accordingly to manage risks and capitalize on opportunities.
Implications of Strong Economic Expectations
While strong economic growth projections support the S&P 500's current valuations, they also introduce certain risks. One critical risk is that these growth expectations are already priced into the market. If economic growth falls short of these optimistic projections, the market could face significant downside pressure as investors recalibrate their expectations.
Additionally, the interplay between economic growth and inflation remains a critical factor. The Federal Reserve's monetary policy, particularly interest rate adjustments in response to inflation trends, can profoundly impact market valuations. For instance, higher-than-expected inflation could prompt the Fed to raise interest rates more aggressively, increasing the discount rate applied to future earnings and thus exerting downward pressure on stock prices.
In summary, the economic growth outlook and investor sentiment are pivotal in shaping the current valuation of the S&P 500. While the projections for robust GDP growth in 2024 support the elevated valuations, they also introduce a degree of fragility. Investors must stay attuned to economic indicators and central bank policies, as deviations from the expected growth path could trigger market volatility. Balancing optimism with caution will be essential for navigating the market landscape in the coming year.
By understanding these dynamics, investors can better position themselves to capitalize on opportunities while mitigating potential risks associated with changes in economic growth expectations and market sentiment.
Sectoral Analysis and Drivers of Valuation
A detailed sectoral analysis of the S&P 500 reveals the drivers behind the index's current valuation. This section examines the performance and valuation of key sectors, focusing on how technological advancements, especially in AI, influence market dynamics.
Impact of Key Sectors
The performance and valuation of individual sectors within the S&P 500 vary significantly, contributing to the overall index's valuation. Notably, the Information Technology and Communication Services sectors are leading the charge, considerably boosting the S&P 500's EPS growth for 2024.
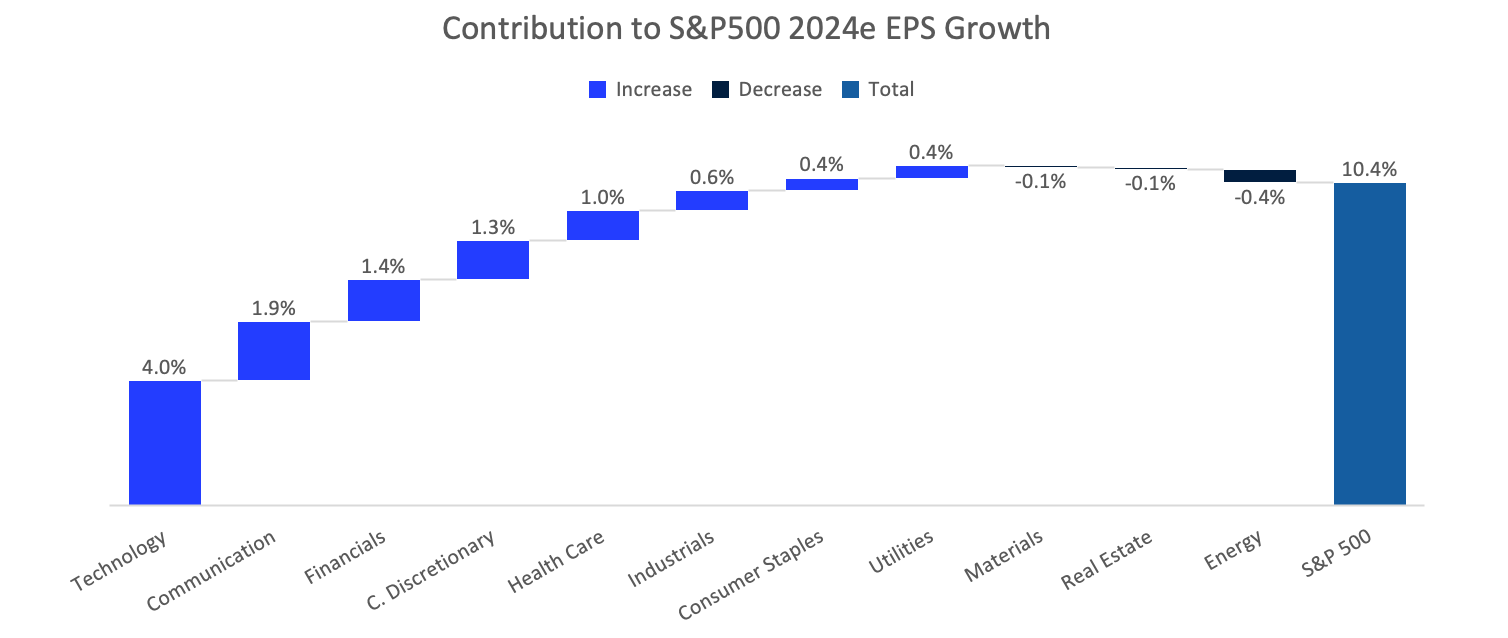
- Information Technology: Contributing 4.0% to the 2024e EPS growth, this sector has been a primary driver of the S&P 500’s performance. Companies within this sector, such as Apple, Microsoft, and NVIDIA, have benefited from increased demand for digital transformation, cloud computing, and AI technologies. The sector's P/E ratio has surged, reflecting high growth expectations and robust financial health.
- Communication Services: With a 1.9% contribution, this sector also significantly benefits from AI advancements and digital transformation. Major players are leveraging AI to enhance customer experiences and streamline operations.
- Financials: This sector contributes 1.4% to the EPS growth, driven by strong economic growth and innovative financial technologies. Financial institutions are adopting AI to improve service delivery and operational efficiency.
- Consumer Discretionary: Contributing 1.3%, this sector includes companies that provide non-essential goods and services, such as Amazon, Tesla, and Home Depot. Performance has been driven by consumer spending and innovation in e-commerce and electric vehicles. The shift towards digital and automated services has played a significant role in its valuation expansion.
- Healthcare: Contributing 1.0%, this sector has shown resilience and steady growth. Companies like UnitedHealth Group and Johnson & Johnson continue to innovate, particularly in biotechnology and pharmaceuticals, supporting their valuations.
- Industrials: This sector contributes 0.6% and benefits from supply chain improvements and increased demand for infrastructure projects. Companies are diversifying their supply chains and investing in resilience to mitigate future disruptions.
- Consumer Staples: Contributing 0.4%, this sector is traditionally stable and includes companies that provide essential goods and services.
- Utilities: Also contributing 0.4%, this sector is integrating technology to improve efficiency and sustainability.
- Real Estate: This sector shows a neutral impact with a 0.0% contribution, reflecting mixed performance due to interest rate fluctuations and market uncertainties.
- Materials: Showing a slight decrease of -0.1%, this sector faces challenges despite integrating new technologies.
- Energy: This sector contributes -0.4%, reflecting the ongoing transition to renewable energy sources and challenges in the traditional energy market.
The overall contribution to the S&P 500 2024e EPS growth is 10.4%.
Role of AI and Technology
The increasing integration of AI and technology across various sectors is a significant trend shaping the S&P 500’s valuation. Companies leverage AI to enhance productivity, reduce costs, and innovate product offerings. This trend is evident in several key areas:
- Productivity and Efficiency: Companies are adopting AI to automate routine tasks, improve operational efficiency, and streamline workflows. For instance, Microsoft has integrated AI across its tech stack, enhancing productivity and attracting new customers.
- Innovation in Offerings: AI drives innovation in products and services. Amazon uses generative AI to enhance customer experiences by summarizing reviews and predicting apparel fit. Similarly, IBM is scaling AI within its operations to boost efficiency and drive digital transformation.
- Investment and Growth: Enthusiasm for AI is reflected in increased capital expenditures and R&D spending. Companies are investing heavily in AI technologies, anticipating significant returns in productivity gains and cost savings. Goldman Sachs estimates that AI investment in the US could approach $100 billion by 2025.
Sectoral Performance and Future Outlook
Analyzing sectoral performance provides insights into the S&P 500’s valuation drivers. The Information Technology and Communication Services sectors are expected to continue leading due to their innovative capabilities and strong market demand. However, other sectors also play crucial roles:
- Industrials and Materials: These sectors benefit from supply chain improvements and increased demand for infrastructure projects. Companies are diversifying their supply chains and investing in resilience to mitigate future disruptions.
- Energy and Utilities: While traditionally stable, these sectors increasingly integrate technology to improve efficiency and sustainability. The transition to renewable energy sources and innovative grid technologies will drive future growth.
- Financials and Real Estate: These sectors are experiencing mixed performance. While some financial institutions are adopting AI to enhance service delivery and operational efficiency, the real estate sector faces challenges from interest rate fluctuations and market uncertainties.
The sectoral analysis of the S&P 500 highlights the diverse drivers of its current valuation. The significant impact of technology, particularly AI, underscores the importance of innovation and digital transformation in shaping market dynamics. Investors should consider these sectoral trends and drivers when making investment decisions, as they offer valuable insights into the future performance and valuation of the S&P 500.
Investors can align their strategies with prevailing market trends by focusing on the sectors leading in innovation and efficiency, such as Information Technology and Communication Services. Additionally, understanding broader sectoral shifts can help identify opportunities and manage risks in a dynamic market environment.
Historical Overvaluation Episodes
Examining historical instances of overvaluation provides valuable insights into the current state of the S&P 500 and helps investors understand potential future market behavior. This section explores past periods of overvaluation, their outcomes, and key takeaways for today's market.
Past Overvaluation Instances
The S&P 500 has historically experienced several episodes where valuations appeared stretched relative to historical norms. These periods are characterized by significantly above-average P/E ratios, often driven by strong economic growth, investor optimism, and bullish market sentiment.
- Late 1990s Dot-com Bubble: One of the most notable periods of overvaluation occurred during the late 1990s, leading up to the dot-com bubble. The S&P 500's P/E ratio surged as technology stocks soared on expectations of transformative growth from internet-related businesses. However, the bubble burst in 2000, leading to a sharp market correction and a prolonged bear market.
- Pre-Global Financial Crisis (2007): Another significant episode of overvaluation was observed in the years preceding the 2008 financial crisis. The S&P 500 reached high valuation levels, fueled by a booming housing market and economic innovation. The subsequent collapse of the housing bubble and the financial sector led to a severe market downturn.
- COVID-19 Pandemic Recovery (2020): More recently, the S&P 500 saw rapid valuation expansion following the initial shock of the COVID-19 pandemic in early 2020. Massive fiscal and monetary stimulus and a swift recovery in corporate earnings drove valuations to new heights. Despite concerns about overvaluation, the market continued to climb, supported by robust economic growth and low interest rates.
Typical Market Behavior Following Overvaluation
Historically, overvaluation alone has not been a reliable predictor of imminent market downturns. The following patterns are observed during periods of significant overvaluation:
- Continued Gains: In many instances, the market has continued to rise for several months following periods of overvaluation. For example, past episodes where the S&P 500's P/E ratio was 10-20% above modeled fair value still saw positive median forward 6-month returns, although below the unconditional average.
- Reduced Returns: While returns remain positive, they tend to be lower than the average returns during periods of fair or undervaluation. This suggests that while overvaluation may signal caution, it does not necessarily indicate an immediate reversal.
- Economic Growth as a Buffer: The economic growth environment is critical in moderating the effects of overvaluation. During periods of strong economic growth, the market can "grow into" its valuations as earnings catch up with prices. Conversely, overvaluation is more likely to lead to correctionsin weak growth environments.
Lessons from the Past
Analyzing historical overvaluation episodes provides several key takeaways for investors today:
- Economic Growth Matters: Strong economic growth can sustain high valuations for extended periods. Therefore, monitoring economic indicators and growth projections is crucial in assessing whether current valuations are justified.
- Caution in High Valuation Periods: While overvaluation does not predict immediate declines, it does warrant caution. Investors should be prepared for lower returns and increased volatility during these periods.
- Diversification and Risk Management: In overvalued markets, diversification and risk management become even more critical. Allocating investments across different sectors and asset classes can help mitigate potential downsides.
- Monitoring Monetary Policy: Central bank policies, primarily interest rate decisions, significantly impact valuations. Low interest rates support higher valuations while rising rates can lead to multiple contractions.
Historical overvaluation episodes highlight the complex interplay between market valuations, economic growth, and investor sentiment. While high P/E ratios signal caution, they do not necessarily predict immediate market corrections. Instead, the broader economic context and growth outlook play pivotal roles in determining future market performance.
Investors should draw lessons from past episodes to effectively navigate the current market environment. By maintaining a balanced approach, focusing on economic fundamentals, and employing robust risk management strategies, investors can better position themselves to weather potential market fluctuations and capitalize on opportunities.
Market Risks and Downside Protection
While the current valuation of the S&P 500 reflects optimism about future economic growth and corporate earnings, it also introduces several potential risks that investors should consider. This section explores these risks and discusses strategies for downside protection to help mitigate potential losses.
Potential Risks to the Valuation Thesis
- Economic Slowdown: An unexpected economic slowdown is a key risk to the current high valuations. While the outlook for 2024 is optimistic, driven by robust GDP growth forecasts, any negative shocks to the economy—such as a recession, geopolitical tensions, or significant disruptions in global trade—could undermine growth expectations and lead to a market correction.
- Inflation and Interest Rates: Persistent inflation remains a significant concern. If inflation rates stay elevated or rise unexpectedly, the Federal Reserve may respond by tightening monetary policy more aggressively than anticipated. Higher interest rates increase the cost of capital and can lead to multiple contractions in equity valuations. This is particularly impactful for high-growth sectors like technology, which are more sensitive to changes in interest rates.
- Earnings Disappointments: High valuations are predicated on the expectation of continued strong earnings growth. Any significant earnings disappointments, whether due to company-specific issues or broader economic factors, could prompt a reevaluation of stock prices and lead to declines. Sectors with inflated valuations, such as technology and consumer discretionary, are especially vulnerable to earnings misses.
- Geopolitical Risks: Global geopolitical uncertainties, including trade conflicts, political instability, and regulatory changes, can threaten market valuations. These events can disrupt global supply chains, affect investor sentiment, and increase market volatility.
Forward-looking Scenarios
Predicting the future performance of the S&P 500 involves considering various economic and market scenarios. This section presents a baseline forecast, explores alternative scenarios, and analyzes the impact of interest rates on market valuations.
Baseline and Alternative Scenarios
Baseline Scenario: Steady Growth
In the baseline scenario, the S&P 500 is expected to maintain its current valuation levels, driven by strong economic growth, stable interest rates, and robust corporate earnings. Key assumptions for this scenario include:
- Economic Growth: Real US GDP growth remains solid, averaging around 2.8% annually, as projected by leading economists. This growth supports continued earnings expansion and investor confidence.
- Inflation: Inflation rates gradually decline and stabilize near the Federal Reserve's 2% target. This reduces the likelihood of aggressive monetary tightening and maintains a favorable environment for equities.
- Interest Rates: The Federal Reserve adopts a cautious approach to interest rate hikes, keeping real yields close to current levels. This helps sustain higher equity valuations by keeping the cost of capital relatively low.
- Corporate Earnings: Corporate earnings growth continues to exceed expectations, driven by productivity gains from technological advancements, particularly in AI, and a strong consumer spending backdrop.
In this scenario, valuation models project that the S&P 500 will end the year with a P/E ratio of around 20x for the aggregate index and 15x for the equal-weighted index.
Alternative Scenarios
- Upside Scenario: Accelerated Growth and Technological InnovationIn this scenario, the S&P 500 could see its P/E ratio expand further, potentially reaching 22x for the aggregate index, as investor enthusiasm drives higher valuations.
- Economic Boom: Real GDP growth surpasses expectations, driven by increased consumer spending, substantial business investment, and a surge in technological innovation.
- Low Inflation and Interest Rates: Inflation remains low, and the Federal Reserve maintains an accommodative monetary policy, keeping interest rates at historically low levels.
- Earnings Outperformance: Corporate earnings significantly outperform projections due to enhanced productivity and new revenue streams from AI and other technological advancements.
- Downside Scenario: Economic Slowdown and Rising RatesIn this scenario, the S&P 500 could experience a significant correction, with the P/E ratio contracting to 17x or lower for the aggregate index, reflecting heightened risk aversion and reduced growth expectations.
- Economic Deceleration: GDP growth slows due to unexpected economic shocks, such as geopolitical tensions, trade disruptions, or a sharp decline in consumer confidence.
- Rising Inflation: Persistent inflation pressures force the Federal Reserve to hike interest rates more aggressively than anticipated, increasing the cost of capital.
- Earnings Disappointments: Corporate earnings fall short of expectations, leading to downward revisions and increased market volatility.
Impact of Interest Rates
Interest rates play a critical role in determining equity valuations. The relationship between interest rates and stock prices is primarily influenced by the cost of capital and the discount rate applied to future earnings.
- Low Interest Rates: When interest rates are low, borrowing costs decrease, encouraging business investment and consumer spending. Lower rates also reduce the discount rate used in equity valuation models, leading to higher present values for future earnings and higher stock prices.
- Rising Interest Rates: Conversely, rising interest rates increase the cost of capital, which can dampen business investment and consumer spending. Higher rates also increase the discount rate, lowering the present value of future earnings and exerting downward pressure on stock prices.
Therefore, the Federal Reserve's monetary policy decisions are crucial in shaping market expectations. For instance, if the Fed signals a prolonged period of low rates, investors may feel more confident in maintaining higher equity valuations. On the other hand, if the Fed indicates a shift towards more aggressive rate hikes, it could trigger a reevaluation of stock prices and lead to market corrections.
Navigating the future performance of the S&P 500 requires a nuanced understanding of various economic and market scenarios. The baseline scenario of steady growth, low inflation, and stable interest rates provides a favorable outlook for maintaining current valuation levels. However, positive and negative alternative scenarios highlight the potential for significant deviations based on economic conditions, corporate earnings, and monetary policy.
Investors should stay informed about macroeconomic trends, monitor central bank communications, and be prepared to adjust their strategies in response to changing conditions. By considering a range of scenarios and their implications, investors can better position themselves to capitalize on opportunities and manage risks in an ever-evolving market landscape.
The S&P 500's current valuations, supported by high P/E ratios and optimistic earnings projections, indicate significant investor confidence. However, historical comparisons and the heavy reliance on the Magnificent 7's performance raise potential red flags. While robust earnings growth is projected, the broader market's dependency on a few tech giants suggests vulnerability. Investors should balance optimism with caution, considering economic growth, interest rates, and inflation expectations. A prudent approach involves remaining vigilant and prepared for potential market adjustments.
In conclusion, while the S&P 500 appears fairly priced by some metrics, it also shows signs of overvaluation compared to historical norms. This duality underscores the importance of a balanced investment approach, combining optimism about future growth with caution about potential downside risks.
Stay tuned for our next post, in which we will dive deeper into sector-specific investment strategies for navigating market volatility.
Don’t miss out on our latest insights! Sign up for our newsletter to receive updates straight to your inbox.


