
Understanding Net Income: The Cornerstone of Financial Health
Net income stands as the bedrock of financial analysis, offering a clear snapshot of a company's profitability. Often referred to as the "bottom line," net income represents the amount of money a business retains after accounting for all expenses, including operational costs, taxes, and interest payments. This crucial metric serves as a key indicator of a company's financial well-being and its ability to generate profit from its operations.
Defining Net Income in the Financial Landscape
Net income, also known as net profit or net earnings, is calculated by subtracting all expenses from a company's total revenue. This figure appears at the bottom of the income statement, hence its colloquial name. For investors, analysts, and business owners alike, understanding how to calculate and interpret net income is essential for making informed financial decisions.
The Significance of Net Income in Business Valuation
- Profitability Measure: Net income directly reflects a company's ability to turn revenue into profit.
- Investment Decisions: Investors often use net income to assess a company's financial health before making investment choices.
- Performance Indicator: Comparing net income across different periods helps track a company's financial performance over time.
Balance Sheet and Financial Statements: The Foundations of Net Income Calculation
To fully grasp the concept of net income, it's crucial to understand its place within the broader context of financial statements. The two primary financial documents involved in net income calculations are the balance sheet and the income statement.
The Balance Sheet: A Snapshot of Financial Position
The balance sheet provides a comprehensive overview of a company's financial status at a specific point in time. It outlines:
- Assets: What the company owns
- Liabilities: What the company owes
- Shareholders' Equity: The net worth of the company
While the balance sheet doesn't directly show net income, it reflects the cumulative effect of net income over time through retained earnings, a component of shareholders' equity.
The Income Statement: Tracking Revenue and Expenses
Also known as the profit and loss statement, the income statement details a company's financial performance over a specific period, typically a quarter or a year. It breaks down:
- Revenue: Money earned from primary business activities
- Expenses: Costs incurred to generate revenue
- Net Income: The final result after subtracting all expenses from revenue
The income statement is where you'll find the detailed calculation of net income, making it the primary focus for our analysis.
Key Concepts for Calculating Net Income: Building Blocks of Profitability
Before diving into the calculation process, it's essential to understand the fundamental components that contribute to net income. These elements form the building blocks of the net income formula and provide insight into a company's financial operations.
Revenue: The Starting Point
Revenue, often called the "top line," represents the total amount of money a company generates from its primary business activities before any expenses are deducted. For a retail company, this would be the total sales of goods, while for a service-based business, it would be the fees collected for services rendered.
Expenses: The Cost of Doing Business
Expenses encompass all the costs a company incurs in the process of generating revenue. These can be broadly categorized into:
- Cost of Goods Sold (COGS): Direct costs associated with producing goods or services sold
- Operating Expenses: Costs related to running the business, such as salaries, rent, and utilities
- Non-Operating Expenses: Costs not directly tied to core business operations, like interest payments on debt
Gross Income: Revenue Minus COGS
Gross income, also known as gross profit, is calculated by subtracting the cost of goods sold from revenue. This figure represents the profit a company makes before accounting for operating expenses and taxes.
Operating Income: Profitability of Core Business
Operating income focuses on the profitability of a company's primary business operations. It's calculated by subtracting operating expenses from gross income, excluding the impact of interest, taxes, and other non-operating items.
Calculating Net Income from the Income Statement: A Step-by-Step Guide
Now that we've covered the key components, let's walk through the process of calculating net income using the income statement. This step-by-step approach will help you understand how each element contributes to the final net income figure.
Step 1: Start with Total Revenue
Begin at the top of the income statement with the total revenue figure. This represents all income generated from the company's primary business activities.
Step 2: Subtract Cost of Goods Sold
Deduct the cost of goods sold from the total revenue. This gives you the gross profit:
Gross Profit = Total Revenue - Cost of Goods Sold
Step 3: Subtract Operating Expenses
Next, subtract all operating expenses from the gross profit. This includes costs like salaries, rent, utilities, and marketing expenses. The result is operating income:
Operating Income = Gross Profit - Operating Expenses
Step 4: Account for Other Income and Expenses
Add any other income (e.g., interest earned on investments) and subtract any other expenses (e.g., interest paid on loans) not included in operating expenses.
Step 5: Subtract Taxes
Finally, subtract the company's income tax expense to arrive at the net income:
Net Income = Operating Income + Other Income - Other Expenses - Taxes
Net Income Formula and Calculation: Putting It All Together
To summarize, the comprehensive net income formula can be expressed as:
Net Income = (Revenue - Cost of Goods Sold - Operating Expenses) + (Other Income - Other Expenses) - Taxes
Let's break this down with a hypothetical example:
| Component | Amount |
|---|---|
| Revenue | $1,000,000 |
| Cost of Goods Sold | $600,000 |
| Operating Expenses | $250,000 |
| Other Income | $20,000 |
| Other Expenses | $30,000 |
| Taxes | $35,000 |
Applying our formula:
- Gross Profit = $1,000,000 - $600,000 = $400,000
- Operating Income = $400,000 - $250,000 = $150,000
- Income Before Taxes = $150,000 + $20,000 - $30,000 = $140,000
- Net Income = $140,000 - $35,000 = $105,000
In this example, the company's net income is $105,000.
Interpreting Net Income Results: Beyond the Numbers
While calculating net income is crucial, understanding what the results mean is equally important. Here's how to interpret net income figures:
Positive Net Income
A positive net income indicates that a company is profitable, generating more revenue than it spends on expenses. However, the context is important:
- Consistent Growth: Steady increases in net income over time generally indicate strong financial health.
- Industry Comparison: Compare the net income to industry averages to gauge relative performance.
- Profit Margins: Consider net income as a percentage of revenue to assess efficiency.
Negative Net Income (Net Loss)
A negative net income, or net loss, occurs when expenses exceed revenue. While concerning, it doesn't always spell disaster:
- Startup Phase: Many new companies experience losses as they invest in growth.
- Cyclical Industries: Some sectors naturally experience periods of loss due to economic cycles.
- One-Time Events: Extraordinary expenses can temporarily push a company into loss.
Using Net Income for Further Analysis
Net income serves as a foundation for calculating other important financial metrics:
- Net Profit Margin: (Net Income / Revenue) x 100
- Measures how much profit is generated as a percentage of revenue
- Return on Equity (ROE): (Net Income / Shareholders' Equity) x 100
- Indicates how efficiently a company uses equity to generate profits
- Earnings Per Share (EPS): Net Income / Number of Outstanding Shares
- Shows the portion of a company's profit allocated to each outstanding share of common stock

Common Pitfalls to Avoid in Net Income Calculations
When calculating and interpreting net income, be aware of these common mistakes:
- Overlooking Non-Operating Items: Ensure all non-operating income and expenses are accounted for.
- Confusing Cash Flow with Net Income: Remember that net income includes non-cash items like depreciation.
- Ignoring One-Time Events: Be cautious of extraordinary items that may skew net income figures.
- Neglecting Seasonality: Some businesses have naturally fluctuating income cycles.
- Failing to Consider Industry Context: What's considered a good net income can vary significantly by industry.

Tools and Resources for Calculating Net Income
To streamline your net income calculations, consider using these tools:
- Financial Software: Programs like QuickBooks or Xero automate many accounting processes.
- Spreadsheet Applications: Microsoft Excel or Google Sheets offer customizable templates for financial calculations.
- Online Calculators: Various websites provide free net income calculators for quick estimations.
- Financial Statement Analysis Tools: Platforms like FinanceCharts or YCharts offer more advanced analysis features.
Real-World Applications of Net Income: Case Studies
Let's examine how net income figures play out in real-world scenarios using data from three major tech companies: Apple, Amazon, and Tesla. These case studies will demonstrate the practical application of net income calculations and their significance in financial analysis.
Revenue Comparison
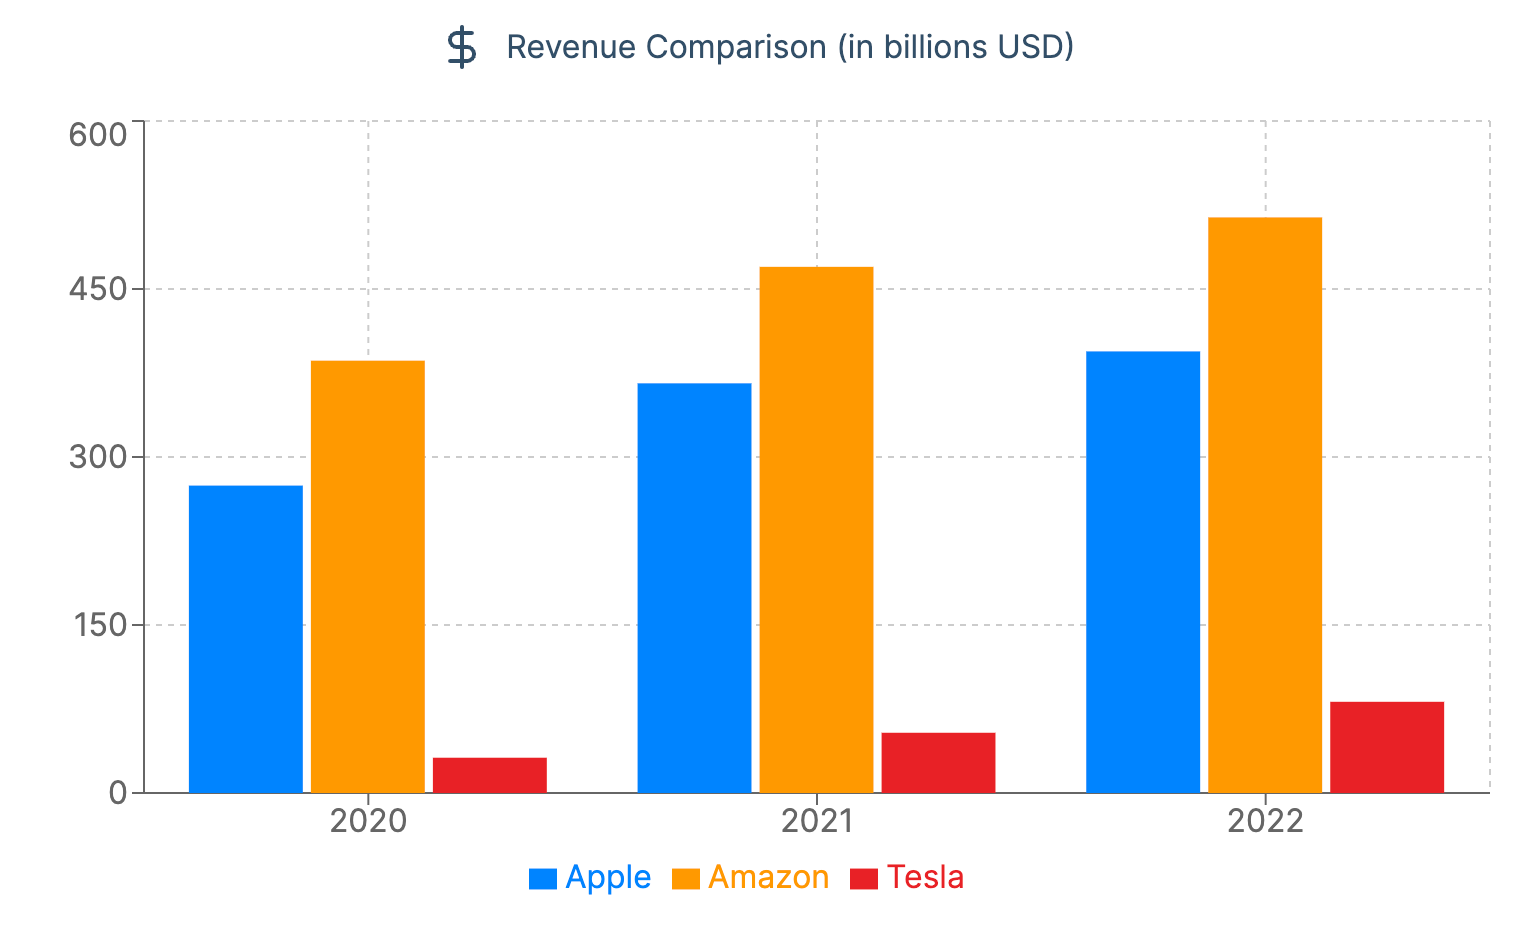
This chart illustrates the revenue trends for Apple, Amazon, and Tesla from 2020 to 2022. We can observe that:
- Amazon consistently leads in revenue, followed by Apple, with Tesla showing significant growth but still trailing behind.
- All three companies demonstrate year-over-year revenue growth.
- Tesla's revenue, while smaller, shows the steepest growth curve relative to its starting point.
Net Income Trends
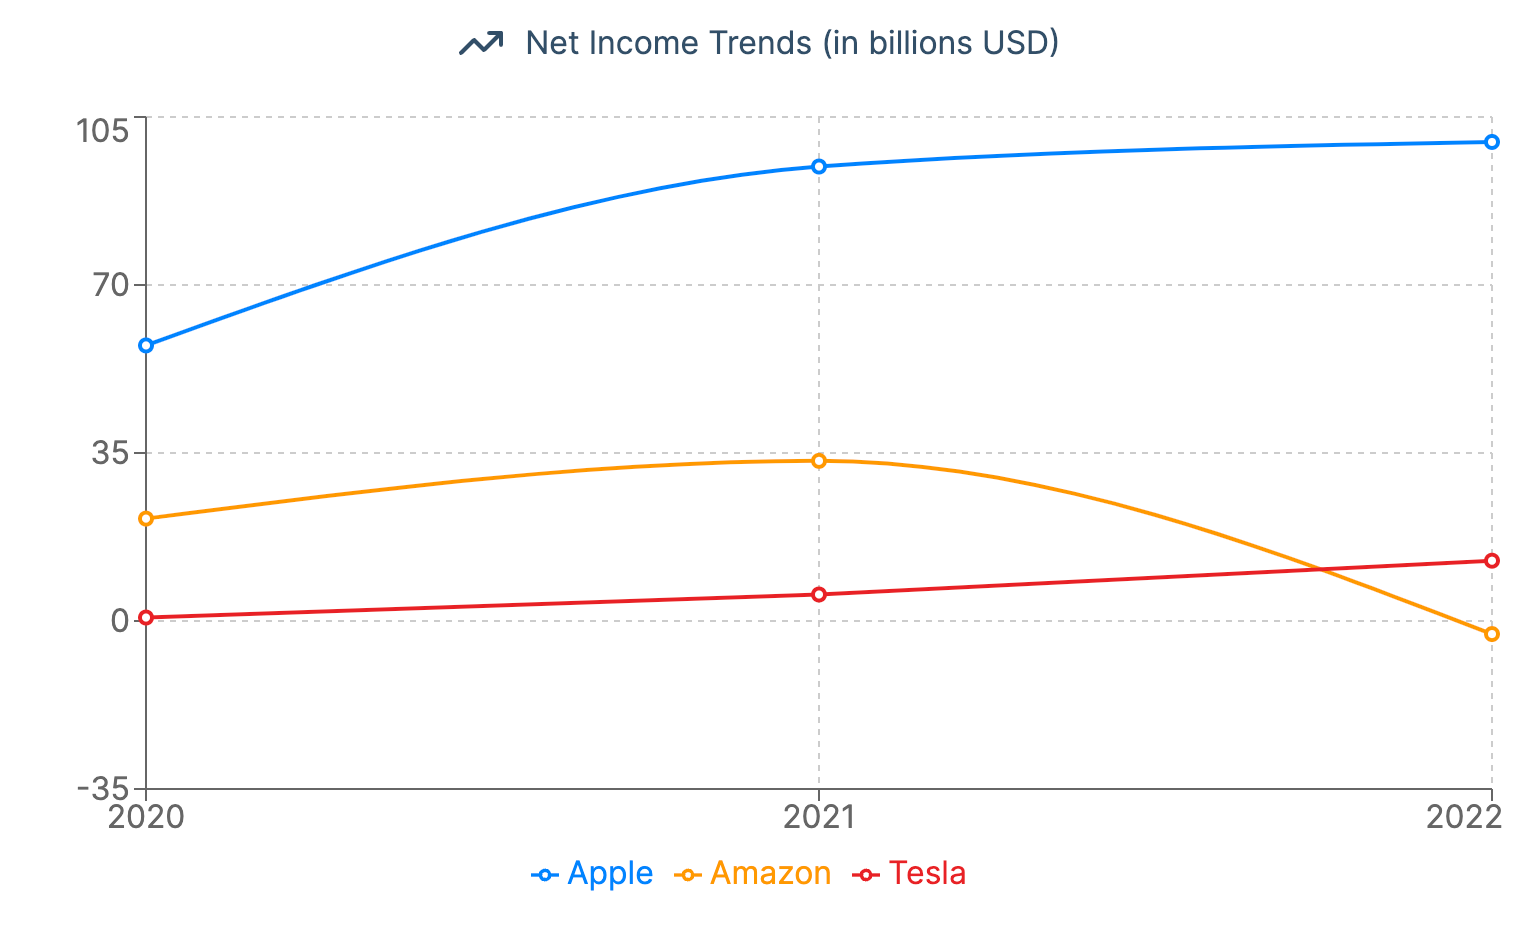
This graph showcases the net income trends for the three companies over the same period:
- Apple maintains the highest net income, with steady growth each year.
- Amazon's net income peaked in 2021 but saw a significant decline in 2022, even dipping into negative territory.
- Tesla shows consistent growth in net income, starting from a low base but steadily increasing each year.
Net Profit Margin Comparison
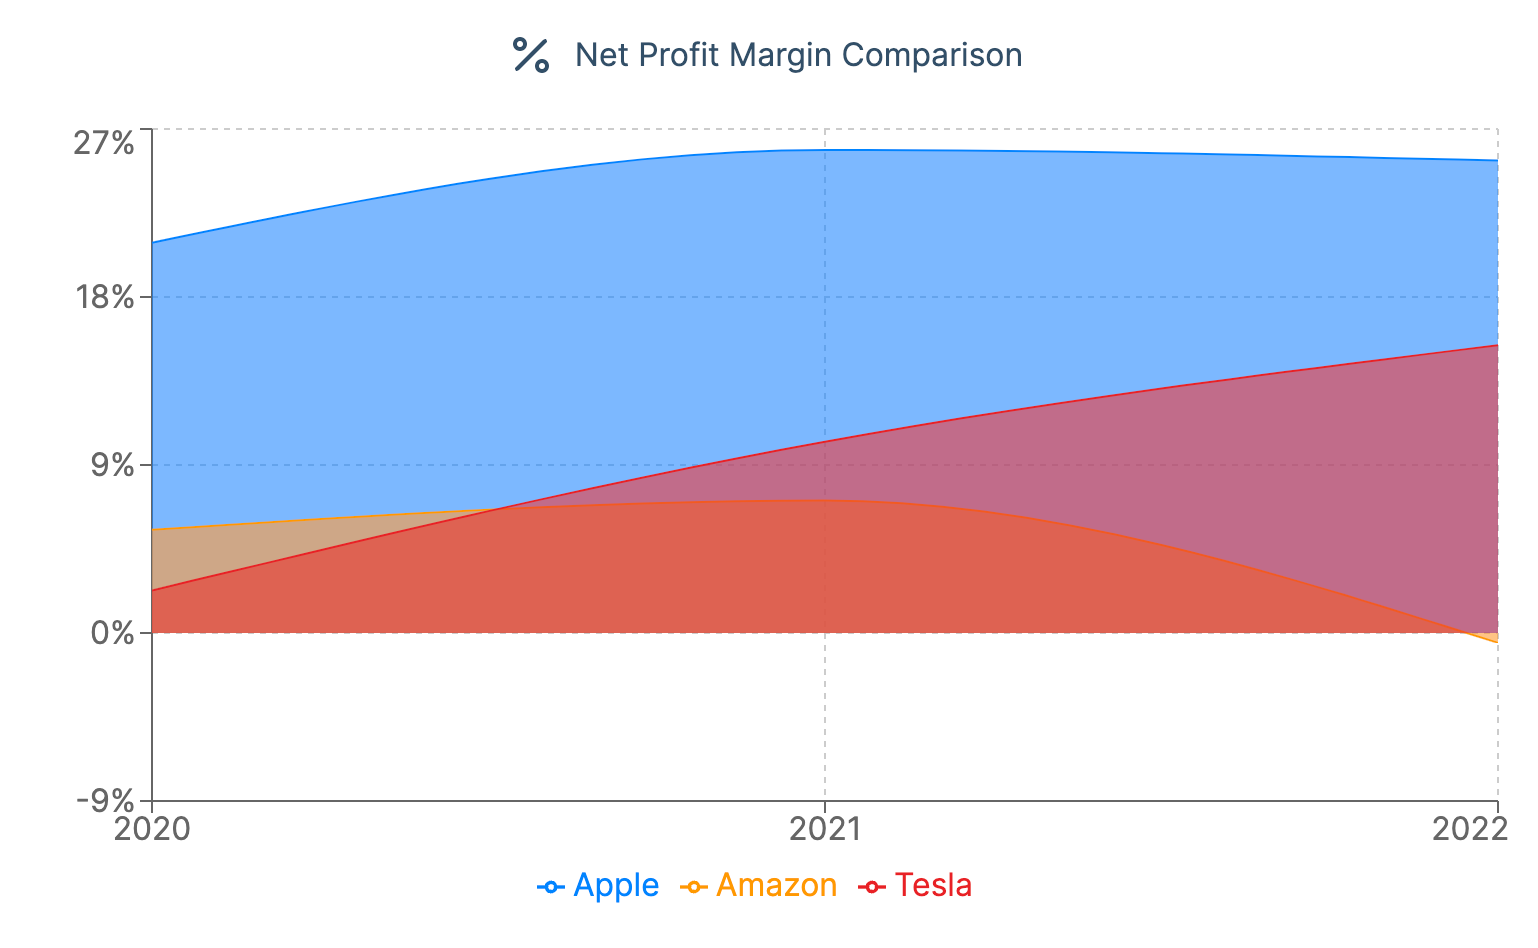
The net profit margin (calculated as Net Income / Revenue) provides insight into each company's profitability:
- Apple consistently maintains the highest net profit margin, hovering around 25%.
- Tesla shows remarkable improvement, starting with the lowest margin in 2020 but surpassing Amazon by 2022.
- Amazon's net profit margin declined sharply in 2022, aligning with its net income drop.
Spotlight on Tesla's Growth
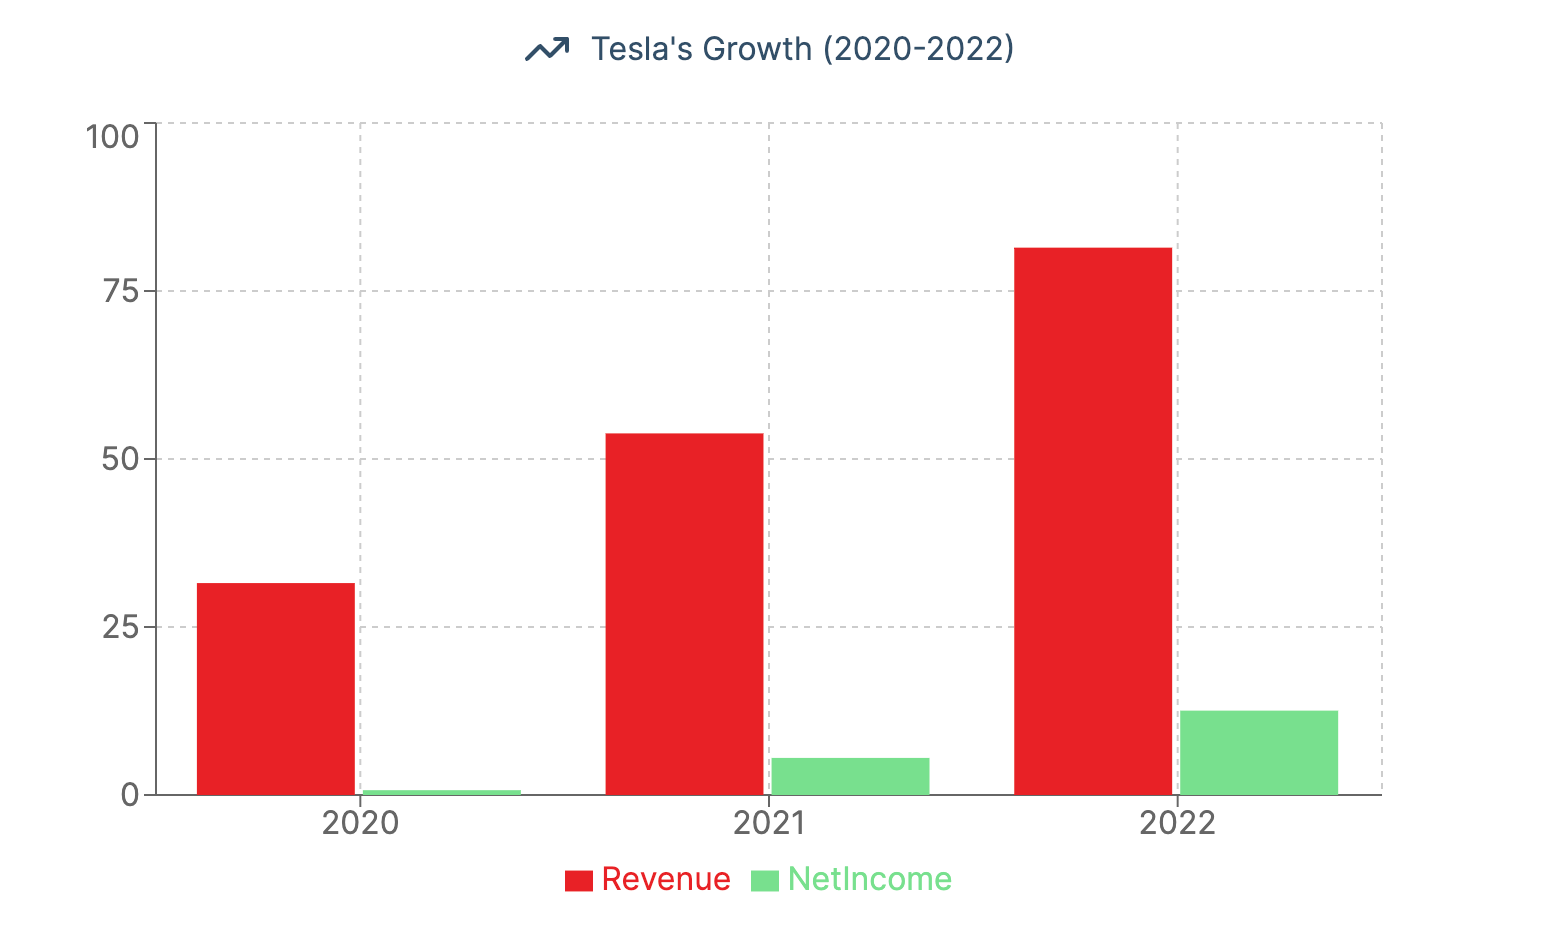
Let's take a closer look at Tesla's financial performance:
- Tesla's revenue (red bars) shows dramatic year-over-year growth from 2020 to 2022.
- Net income (green bars) also demonstrates significant growth, albeit at a slower pace than revenue.
- The widening gap between revenue and net income bars indicates increasing operational costs as the company scales.
Key Takeaways from These Case Studies
- Revenue vs. Net Income: High revenue doesn't always translate to high net income, as seen with Amazon in 2022.
- Profitability Trends: Net income trends can diverge from revenue trends, highlighting the importance of cost management and operational efficiency.
- Growth Patterns: Rapid growth companies like Tesla may prioritize revenue expansion over short-term profitability, as evidenced by its improving but still relatively low net profit margin.
- Industry Comparisons: Even within the tech sector, companies can have vastly different financial profiles based on their business models and growth stages.
- Volatility: Net income can be more volatile than revenue, as seen with Amazon's fluctuations, emphasizing the need for careful financial analysis.
These real-world examples underscore the importance of calculating and interpreting net income in the context of other financial metrics and industry trends. They also highlight why investors and analysts must look beyond top-line revenue figures to truly understand a company's financial health and performance.
Conclusion: Mastering Net Income for Financial Success
Understanding how to calculate and interpret net income is a fundamental skill for anyone involved in business finance, investing, or financial analysis. By mastering this concept, you gain valuable insights into a company's profitability, operational efficiency, and overall financial health.
Remember these key takeaways:
- Net income is a crucial indicator of a company's profitability and financial performance.
- Accurate calculation requires a thorough understanding of revenue, expenses, and financial statements.
- Interpreting net income involves considering industry context, company growth stage, and broader economic factors.
- Use net income as a starting point for deeper financial analysis, including profit margins and return on equity.
- Be aware of common pitfalls and use appropriate tools to ensure accurate calculations.
By applying the knowledge and techniques outlined in this guide, you'll be well-equipped to analyze financial statements, make informed investment decisions, and contribute to strategic business planning. As you continue to refine your skills in calculating and interpreting net income, you'll develop a deeper understanding of financial analysis and its critical role in driving business success.
FAQ: Calculating Net Income
What's the difference between net income and gross income?
Gross income is the total revenue minus the cost of goods sold, while net income is the final profit after deducting all expenses, including taxes and interest.
Can a company have positive cash flow but negative net income?
Yes, this can happen due to non-cash expenses like depreciation or when a company receives advance payments for services not yet rendered.
How often should net income be calculated?
Most companies calculate net income quarterly and annually, aligning with financial reporting standards. However, more frequent calculations can provide valuable insights for internal decision-making.
Is a high net income always a good sign?
While generally positive, a high net income should be considered in context. Factors like industry standards, company size, and growth stage all play a role in interpreting net income figures.
How does net income relate to earnings per share (EPS)?
Earnings per share is calculated by dividing net income by the number of outstanding shares, providing a per-share profitability metric often used by investors.


